Historical Coastal Change at Sunderland Point
In this article, we welcome Claire Bradshaw of Morecambe Bay Partnership, who has worked with the community as part of the Our Future Coast project to provide the historical background.
The Sunderland Point community is part of a pioneering project to test and trial ‘Nature Based Solutions’ that work with natural processes to manage local coastal change. The project is one of 17 case study sites around the North West coast included in the DEFRA-funded Our Future Coast programme which aims to enhance the resilience of coastal communities to flooding and erosion using Nature Based Solutions like saltmarshes and sand dunes.
As part of this project, we wanted to understand how the estuary and saltmarsh around Sunderland Point have changed in the past and what this might mean for the future. By studying how our coastlines have evolved, we can make informed decisions about the best methods and locations for the interventions that we hope will protect these vital ecosystems and communities for generations to come.
The Our Future Coast team worked with a Task Group of residents and landowners with an interest in Sunderland Point to develop a list of questions we had about the history of coastal change. We drew on existing historic research and coastal processes reports for the Lune estuary to find gaps in our knowledge of how the landscape developed and how this has affected water movement around Sunderland Point.
We then worked with members of the Sunderland Point community to find historical maps, documents, and photographs which would help to reconstruct changes around the peninsula in the last 300 years, along four major themes: saltmarsh, the river channel, erosion rates, and flooding events.
From these documents we have produced a report which describes the key changes at Sunderland Point, their likely causes, and gives some suggestions for how the historical data can support effective use of Nature Based Solutions in this area. We have chosen a few of our findings to share here, and you can download the full report for more details and illustrations.
Saltmarsh at Sunderland Point
In 2025 the Sunderland Point peninsula was surrounded by just over 1.5 km2 of saltmarsh. We know from conversations with members of the community that some parts of the saltmarsh have been shrinking in recent years and there were concerns about what this might mean for flood defence.
We examined historic maps to measure the amount of saltmarsh at different points in the past to track rates of growth and erosion. We also compared photographs from the early 1900s to the present to gain a better understanding of the changing density of saltmarsh over time.
West Shore
The earliest detailed maps we have of Sunderland Point, from 1844 show very limited amounts of saltmarsh. An Admiralty sea chart of Morecambe Bay showed 0.18km2 of saltmarsh at West Shore. Since that time, saltmarsh on the western side of the peninsula has spread across the sandbanks, measuring 0.88km in 2023, a growth of 399%.
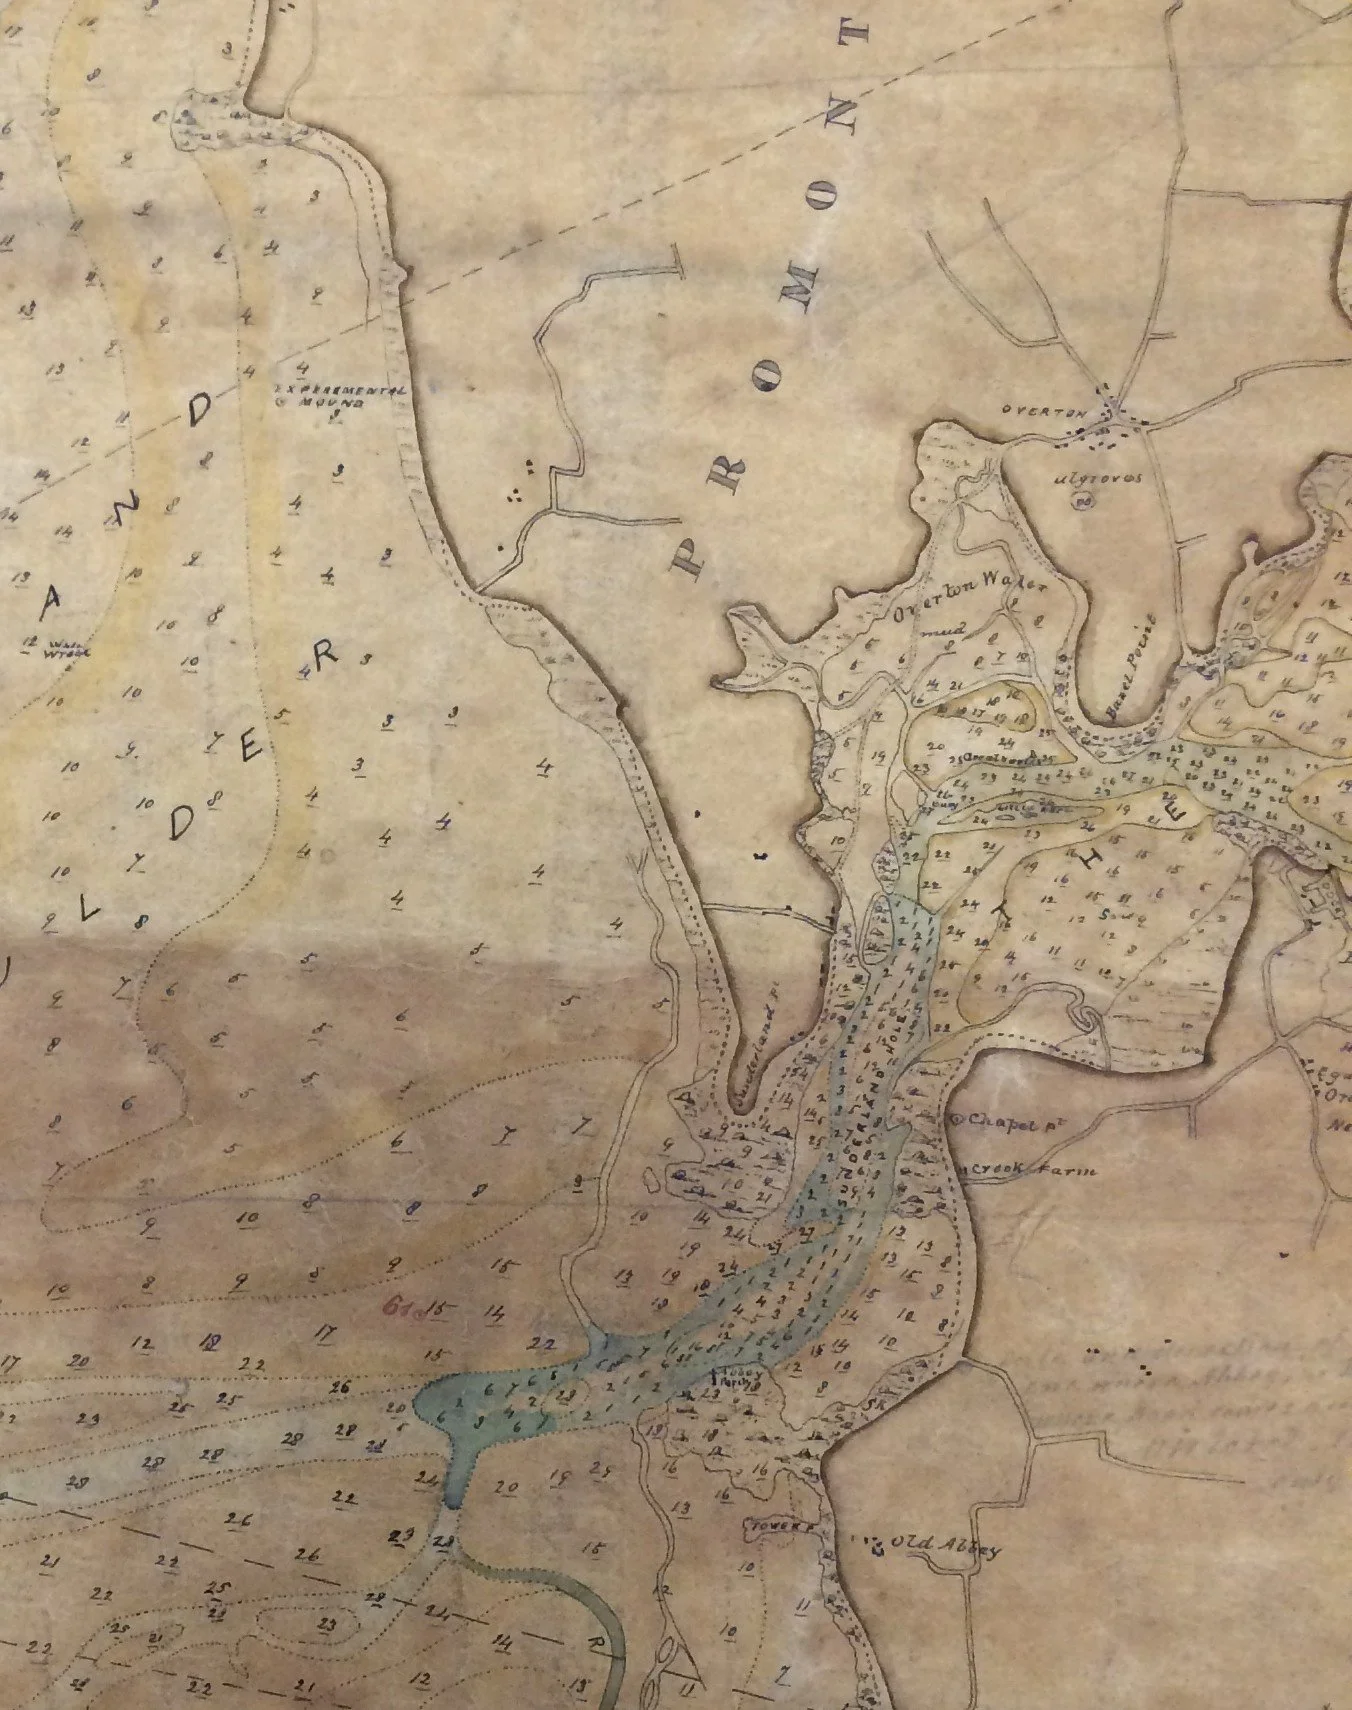
Extract from Admiralty Sea Chart, Morecambe Bay, Commander Denham, R.N. 1844
Since 1844, the area of the saltmarsh at West Shore has been mapped several times. As there are large jumps in time between many of the maps now available it is not possible to calculate how the rate of growth has changed over time. However, the data we do have suggest that this growth has been fairly consistent.
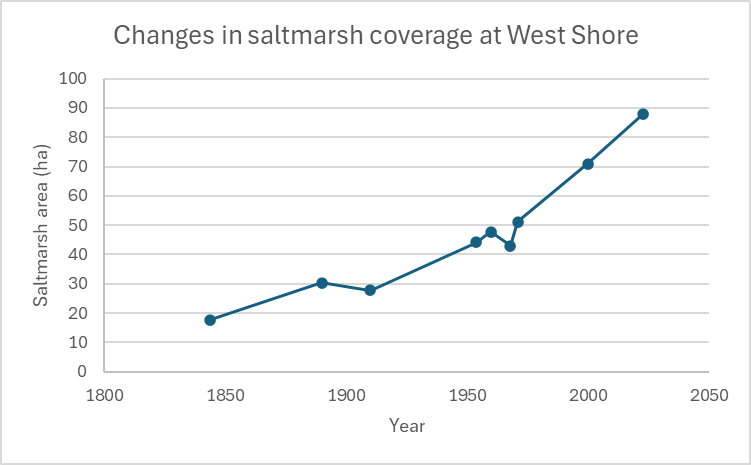
Chart showing growth trend in the saltmarsh at West Shore on OS maps between 1844 and 1971
There are some notable exceptions where we see erosion of vegetation. The greatest loss was between 1890 and 1910, when 3.48ha was eroded. While we do not have direct evidence for the cause of this loss, we do know that there were severe flood events in 1890, 1899, and 1907 which may have contributed.
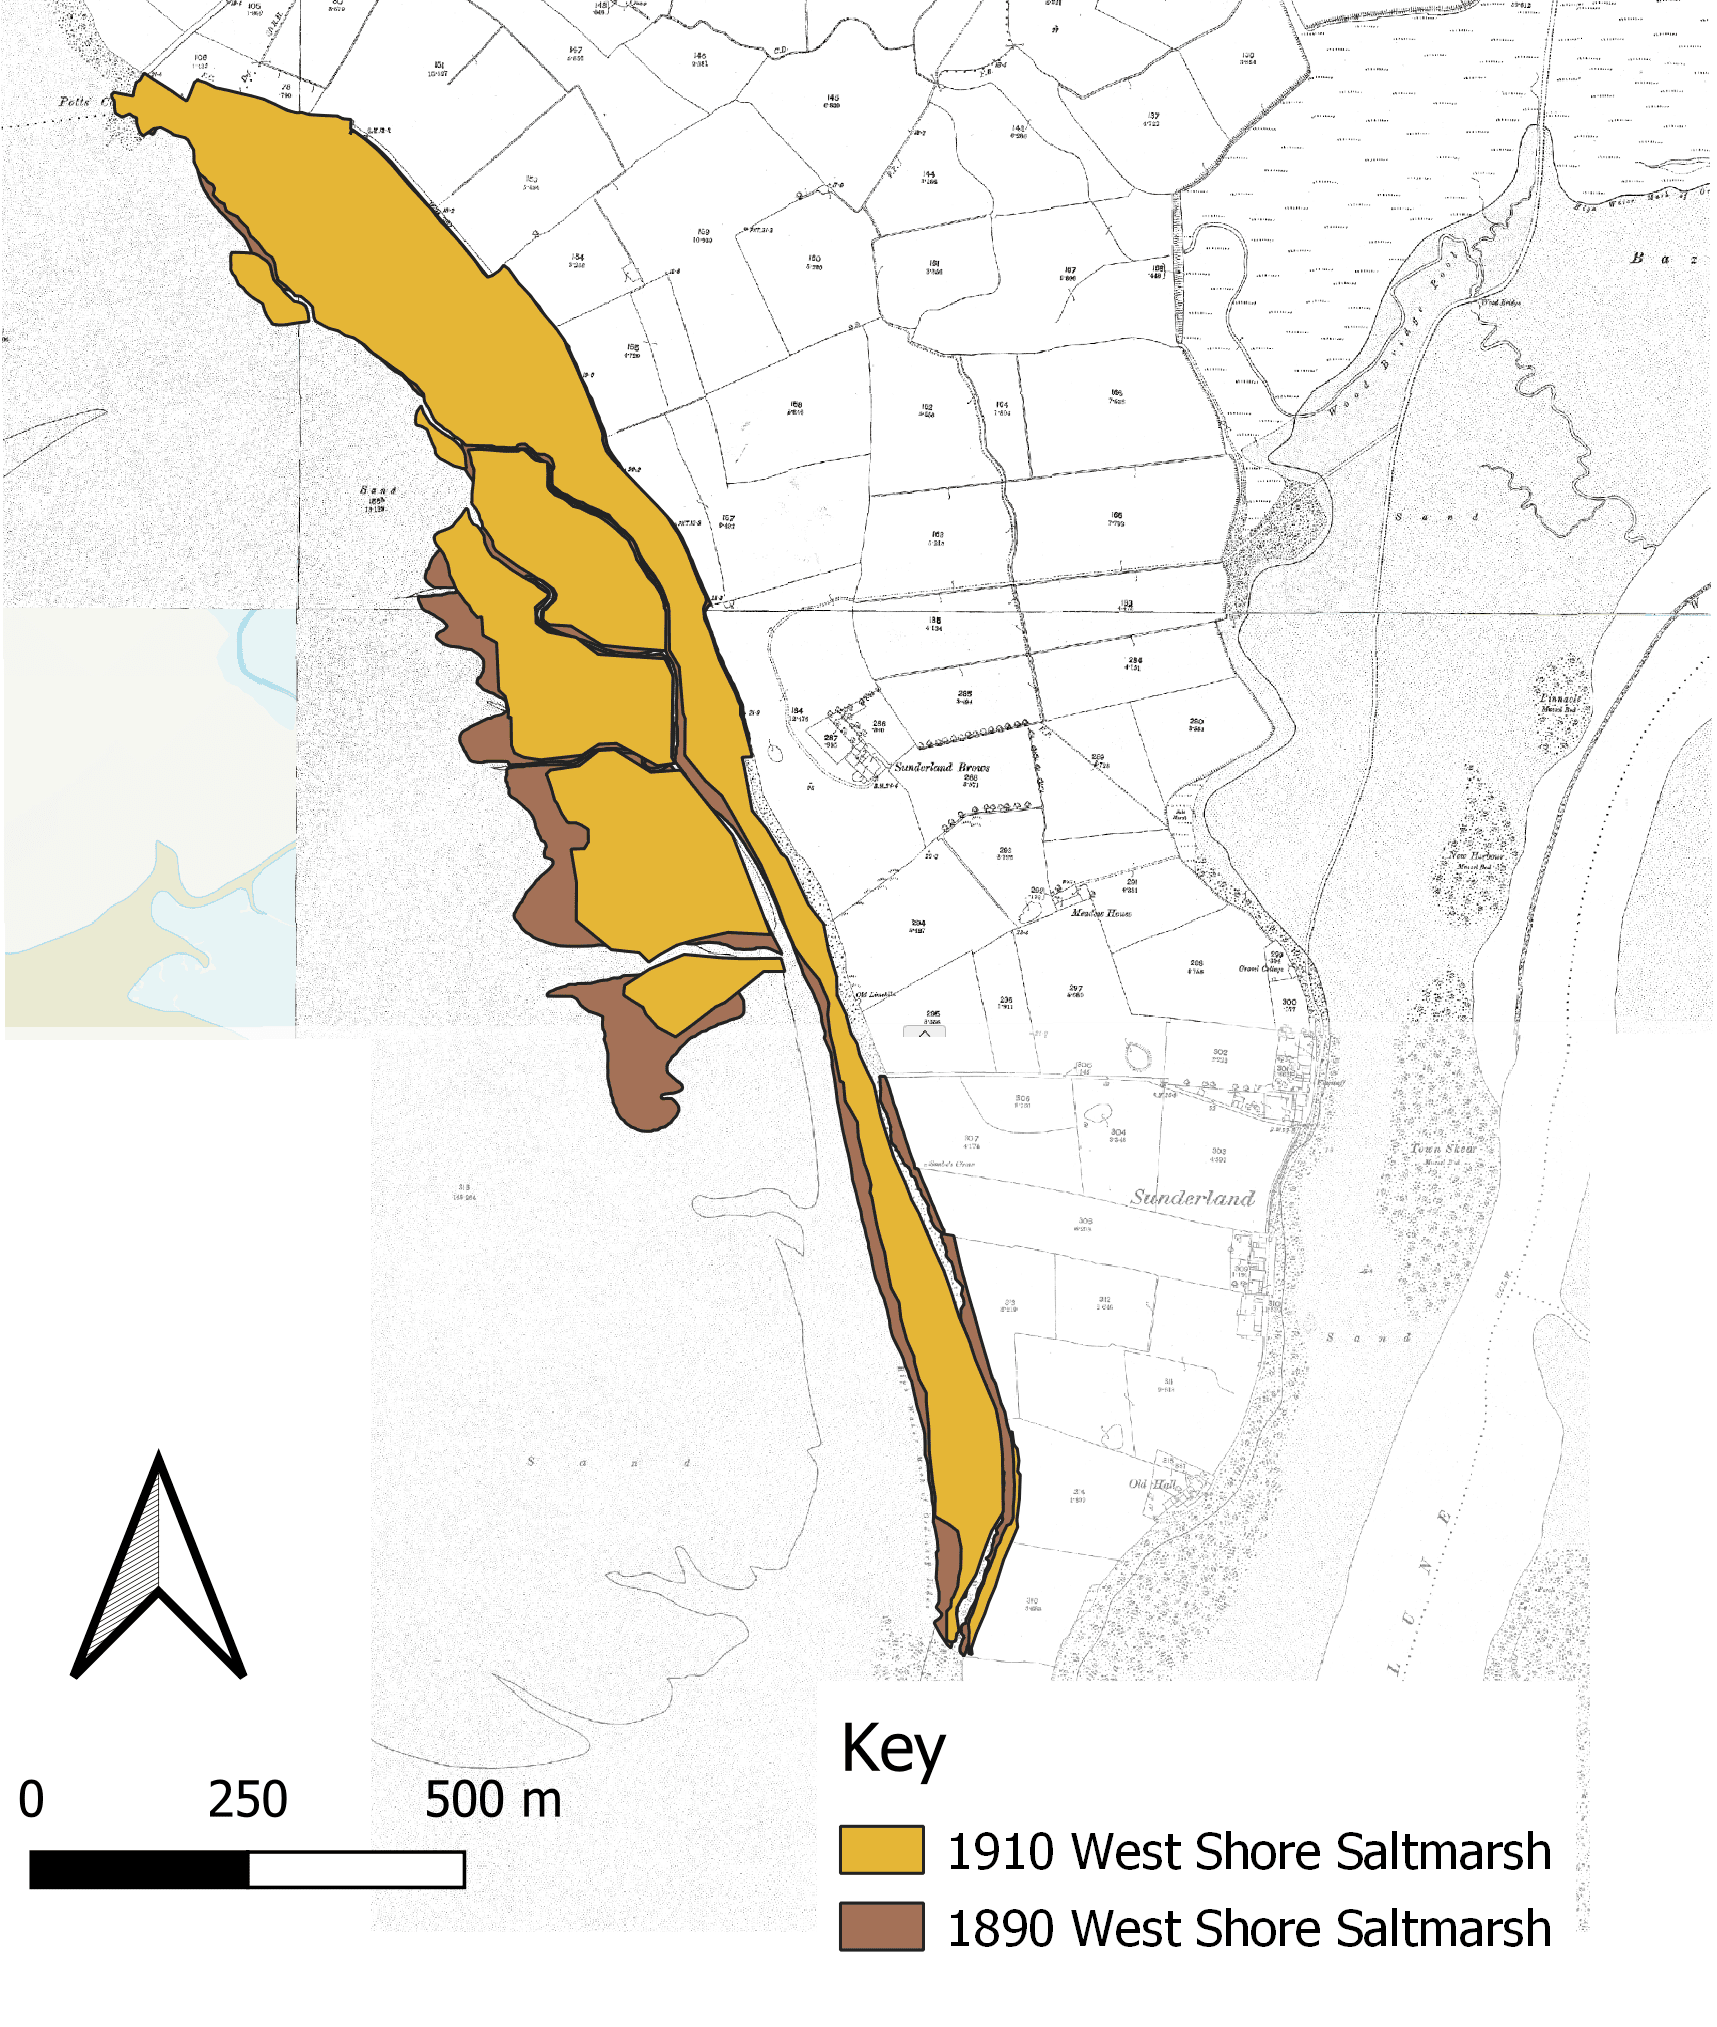
Extent of saltmarsh on the 1890 and 1910 OS maps, overlaid on the OS England & Wales, Six inch, Lancashire Sheet XXXIV, Surveyed: 1890, Published: 1895 CC-BY National Library of Scotland
After a period of regrowth, we then see another decline between the 1954 and 1968 maps, this time of 1ha. It is possible that more of the marsh was lost at this time. An aerial photograph taken in 1963 shows that it had grown by 3 ha since 1954, meaning that 4 ha had been eroded between 1963 and 1968. This may, however, be due to a discrepancy in how saltmarsh was mapped by the Ordnance Survey and how we identified saltmarsh in the aerial photo.
The largest fluctuations in the area of saltmarsh were in the central part of the peninsula, between the road north of Sunderland Brows Farm and Sambo’s Grave.
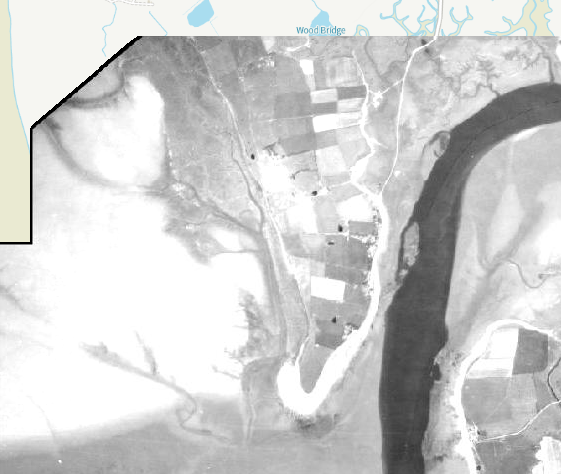
Aerial photograph of Sunderland Point, taken by the RAF Operation Revue in 1948
More recently, some of the marsh has been lost, particularly around the larger channels towards Point End, which are more vulnerable to wave attack. This loss has likely been accelerated by the erosion, or deliberate removal of the large skear (a shingle bed, which would have hosted mussels) which once protected Point End. The shelf of silty clay that the marsh sits on stretches further into Morecambe Bay before it drops off into deeper waters, making it likely that vegetation could spread across the tidal flat without intervention. Small scale repairs, using sediment traps, around the larger channels could help stabilise them and reduce the distance waves can travel into the marsh.
Lades Marsh
Lades Marsh has also grown considerably over the last two centuries. In 1844, most of the mapped saltmarsh between Sunderland Point and Bazil Point was on the landward side of the current sea embankment, except for a small area around Lades Pool which stretched to just south of the causeway. Only part of this embankment had been built at the time, so it seems likely that the land behind it had only recently been enclosed and was only in the early stages of drying out.
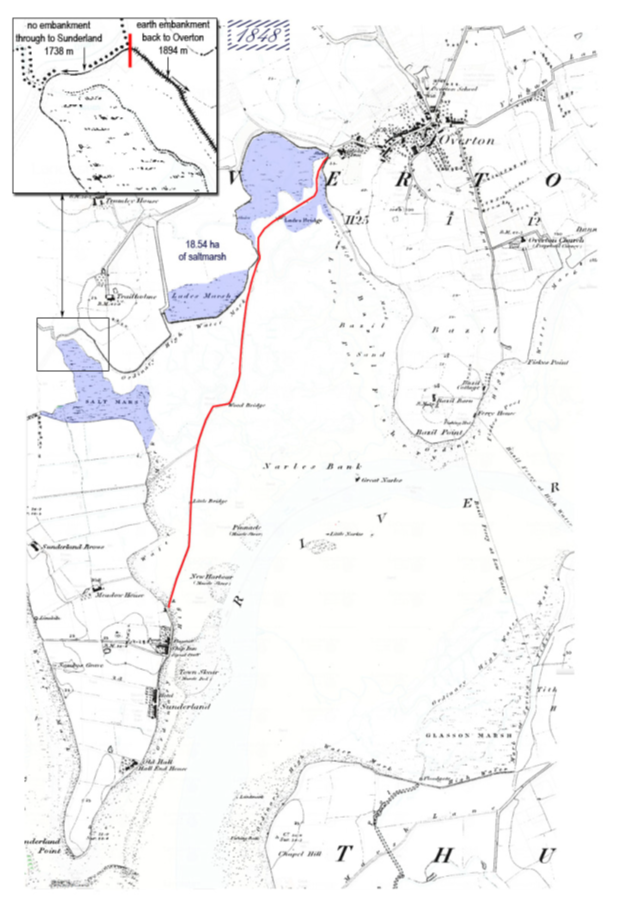
The Lower Lune estuary 1848 OS First Edition map 1:10,000. Blue areas denote the extent of saltmarsh (18.54 ha) from Hughes, I. 2016 Ap. 1-4
By 1893 the land behind the embankment was no longer shown as being wet and 40.43ha of new marsh had formed on its seaward side. This growth appears to have been rapid and was likely triggered by the construction of the training wall in the 1860s which moved the river to a single channel further from the shore, allowing vegetation to spread.
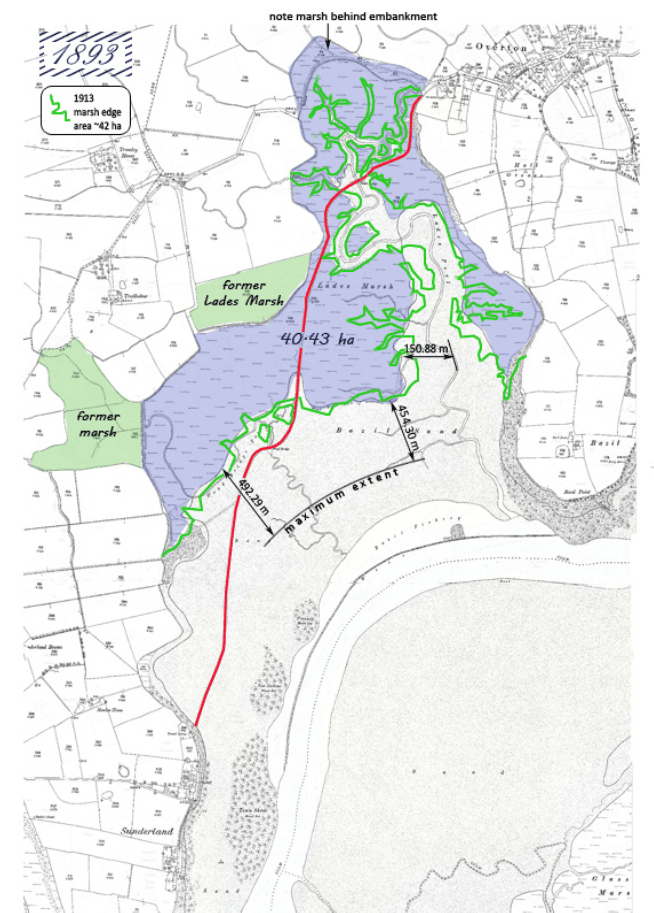
Image 6 The Lower Lune estuary 1893 OS First Edition map 1:2,500 Blue areas denote the extent of saltmarsh (40.43 ha) from Hughes, I. 2016 Ap. 1-5
Marsh growth slowed after 1893 but continued to spread gradually until 1955 when there was another period of rapid expansion. Earlier writers have taken this burst of growth between 1955 and the 1970s to mean that marsh accretion was unlikely to have been related to the Sunderland training wall, as the wall would have been too damaged to be effective by this time. The Lancaster Port Commissioners minutes, however, record considerable repair work had been done on the walls between 1952 and 1955, and that in 1956 work was progressing well with raising the height of the training wall by two feet. The timing of these interventions compared to periods of expansion in the marsh suggest a very strong link between the training walls and saltmarsh growth.
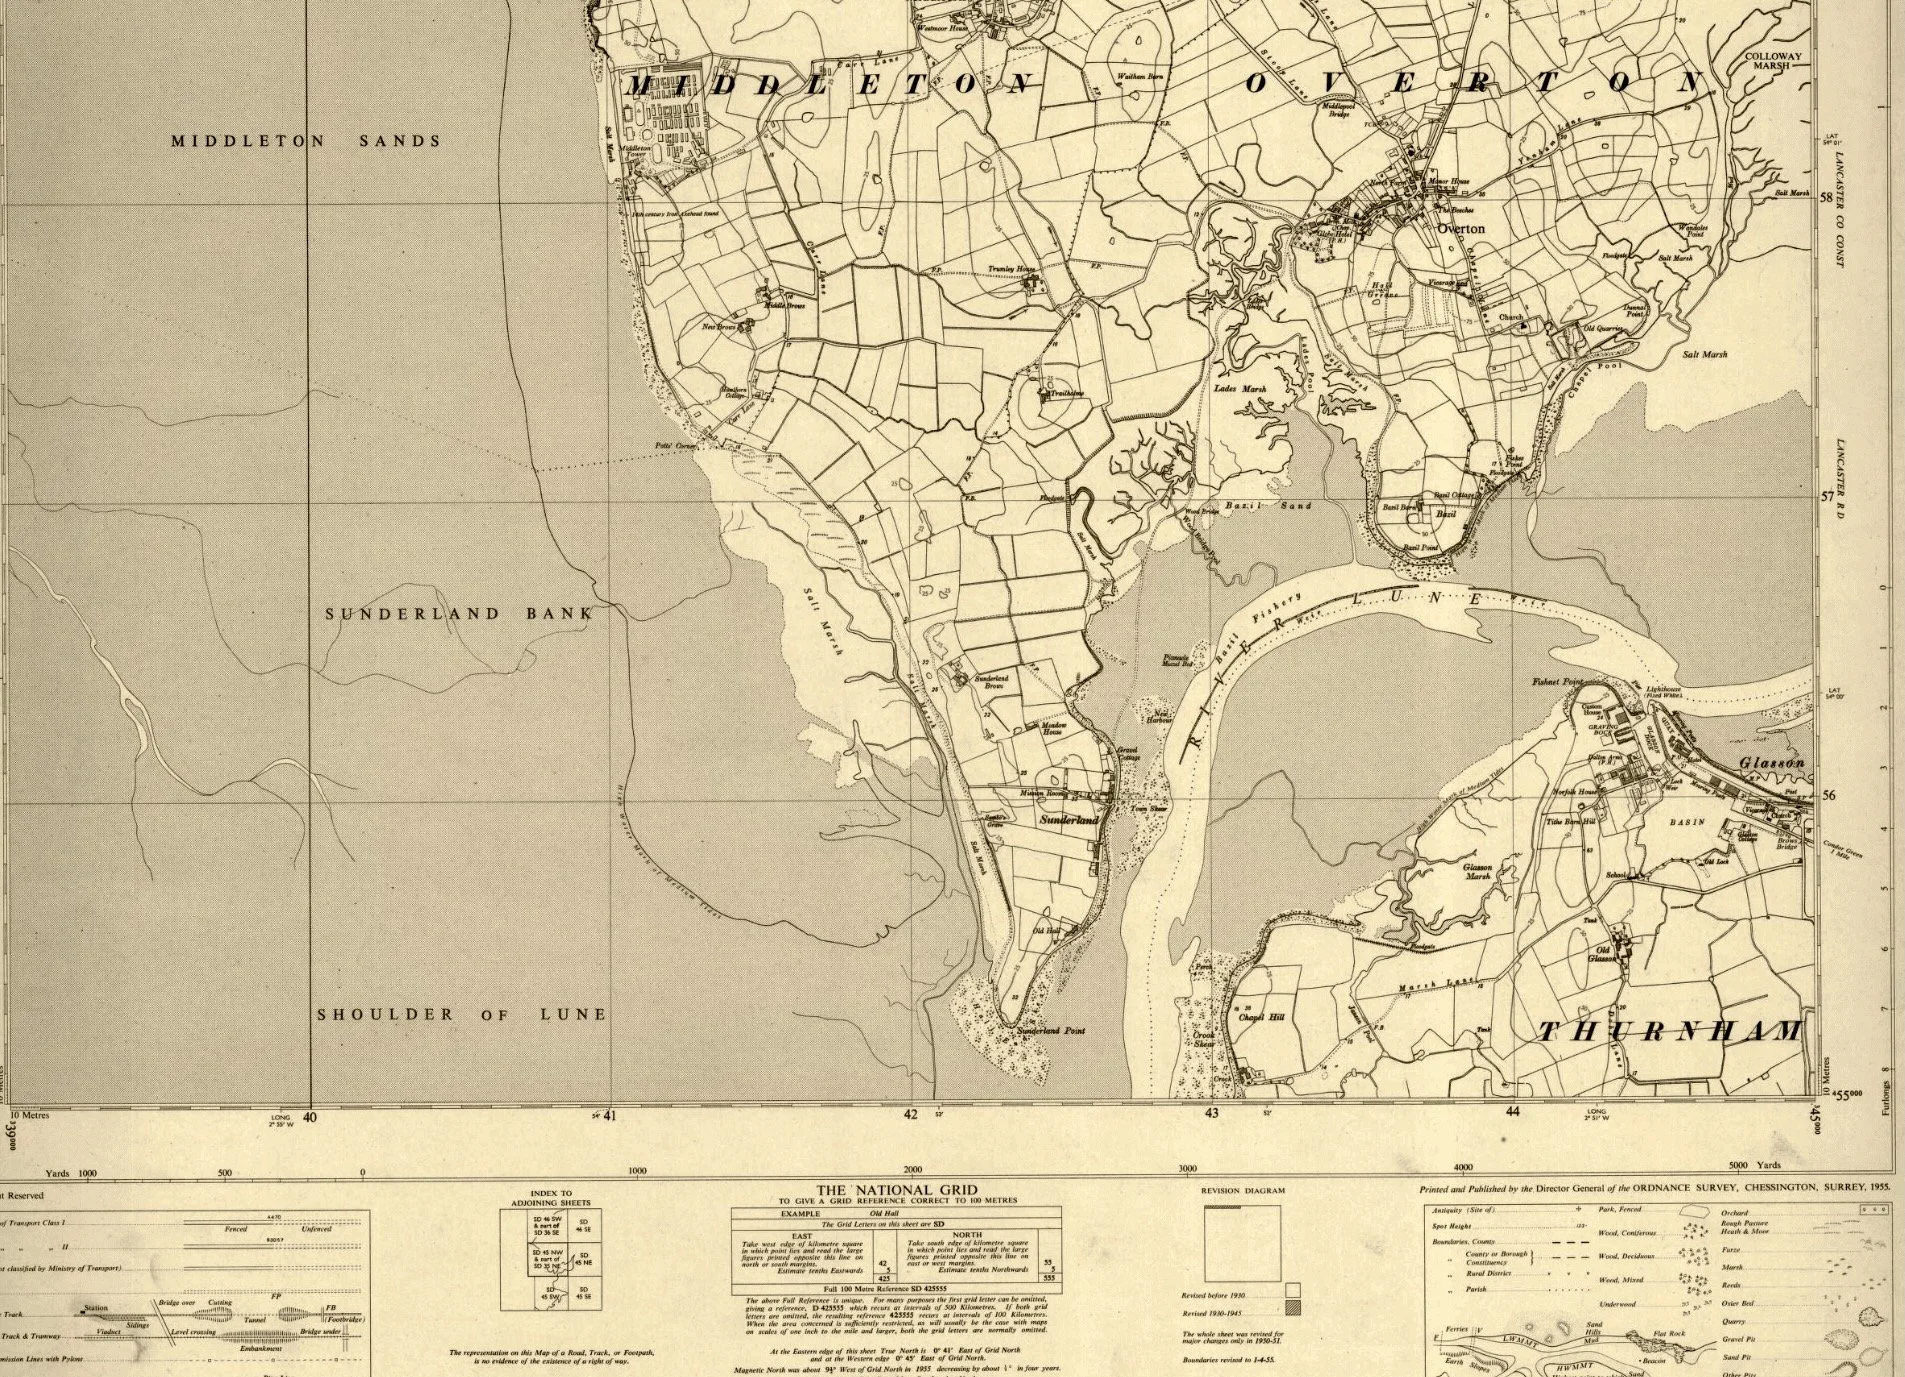
National Grid maps, 1944-1975, SD45NW & part of SD35NE – A Surveyed / Revised: Pre-1930 to 1955, Published: 1955 CC-BY National Library of Scotland
The saltmarsh at Lades Marsh is reasonably stable at present. Some horizontal erosion is occurring, and this is most likely caused by tide reflection as the estuary turns, and deterioration of training wall. Repair of the training wall could help to restore marsh; however, this is not sustainable long term and may have adverse impacts by narrowing the channel and increasing storm surges.
A better option here may be for managed realignment of Overton Embankment, flooding some of the reclaimed marshland around the top of the peninsula to reinstate some of the flood plain. This would have to be monitored closely given how much of the area west of Lancaster is former marshland as it might push the issue onto Overton and Middleton.
Land Reclamation
Land reclamation, or more accurately land creation, the process of draining wetlands for farming use, has had a major impact all around Morecambe Bay. This was carried out on a small scale from the 13th to the 16th centuries usually by increasing the drainage around the edges of peat bogs. From the 17th to the 19th centuries, the agricultural revolution and the national interest in land improvement accelerated this process. As a result, most of England’s common land was enclosed, peat bogs were drained, and embankments were built to win more land from the sea. In Morecambe Bay, the construction of the railways in the 1850s increased the rate of this reclamation as wetland was usually flat and cheap, so ideal for building new lines.
In earlier periods, parts of Sunderland Point and the rest of the land northwest of the Lune would have been a mixture of small hills left by glaciers, saltmarsh, and peat bog (for more details about the geology of the area, see the full report).
Direct archival evidence of when parts of the Sunderland Peninsula and surrounding landscape were drained and enclosed is sadly lacking locally, but there can be no doubt that the process started before the 19th century.
The Wetlands of North Lancashire study in 1995 found a document stating that drainage works were taking place in nearby Poulton and Torrisholme Mosses in the late 18th century, although the document implies that much of the moss was already drained at this point. There are hints in the National Archive catalogue, to be followed up in future research, that suggest an early 17th or possibly even mid-16th century date for the drainage closer to Sunderland Point.
More concrete evidence of where these changes have been made can be seen in later sources. The 1844 Overton Tithe map marks drainage ditches in blue showing that, aside from the small glacial drumlins where towns and farms have been built, much of the land north of The Lane to Heysham was wetland before humans intervened.
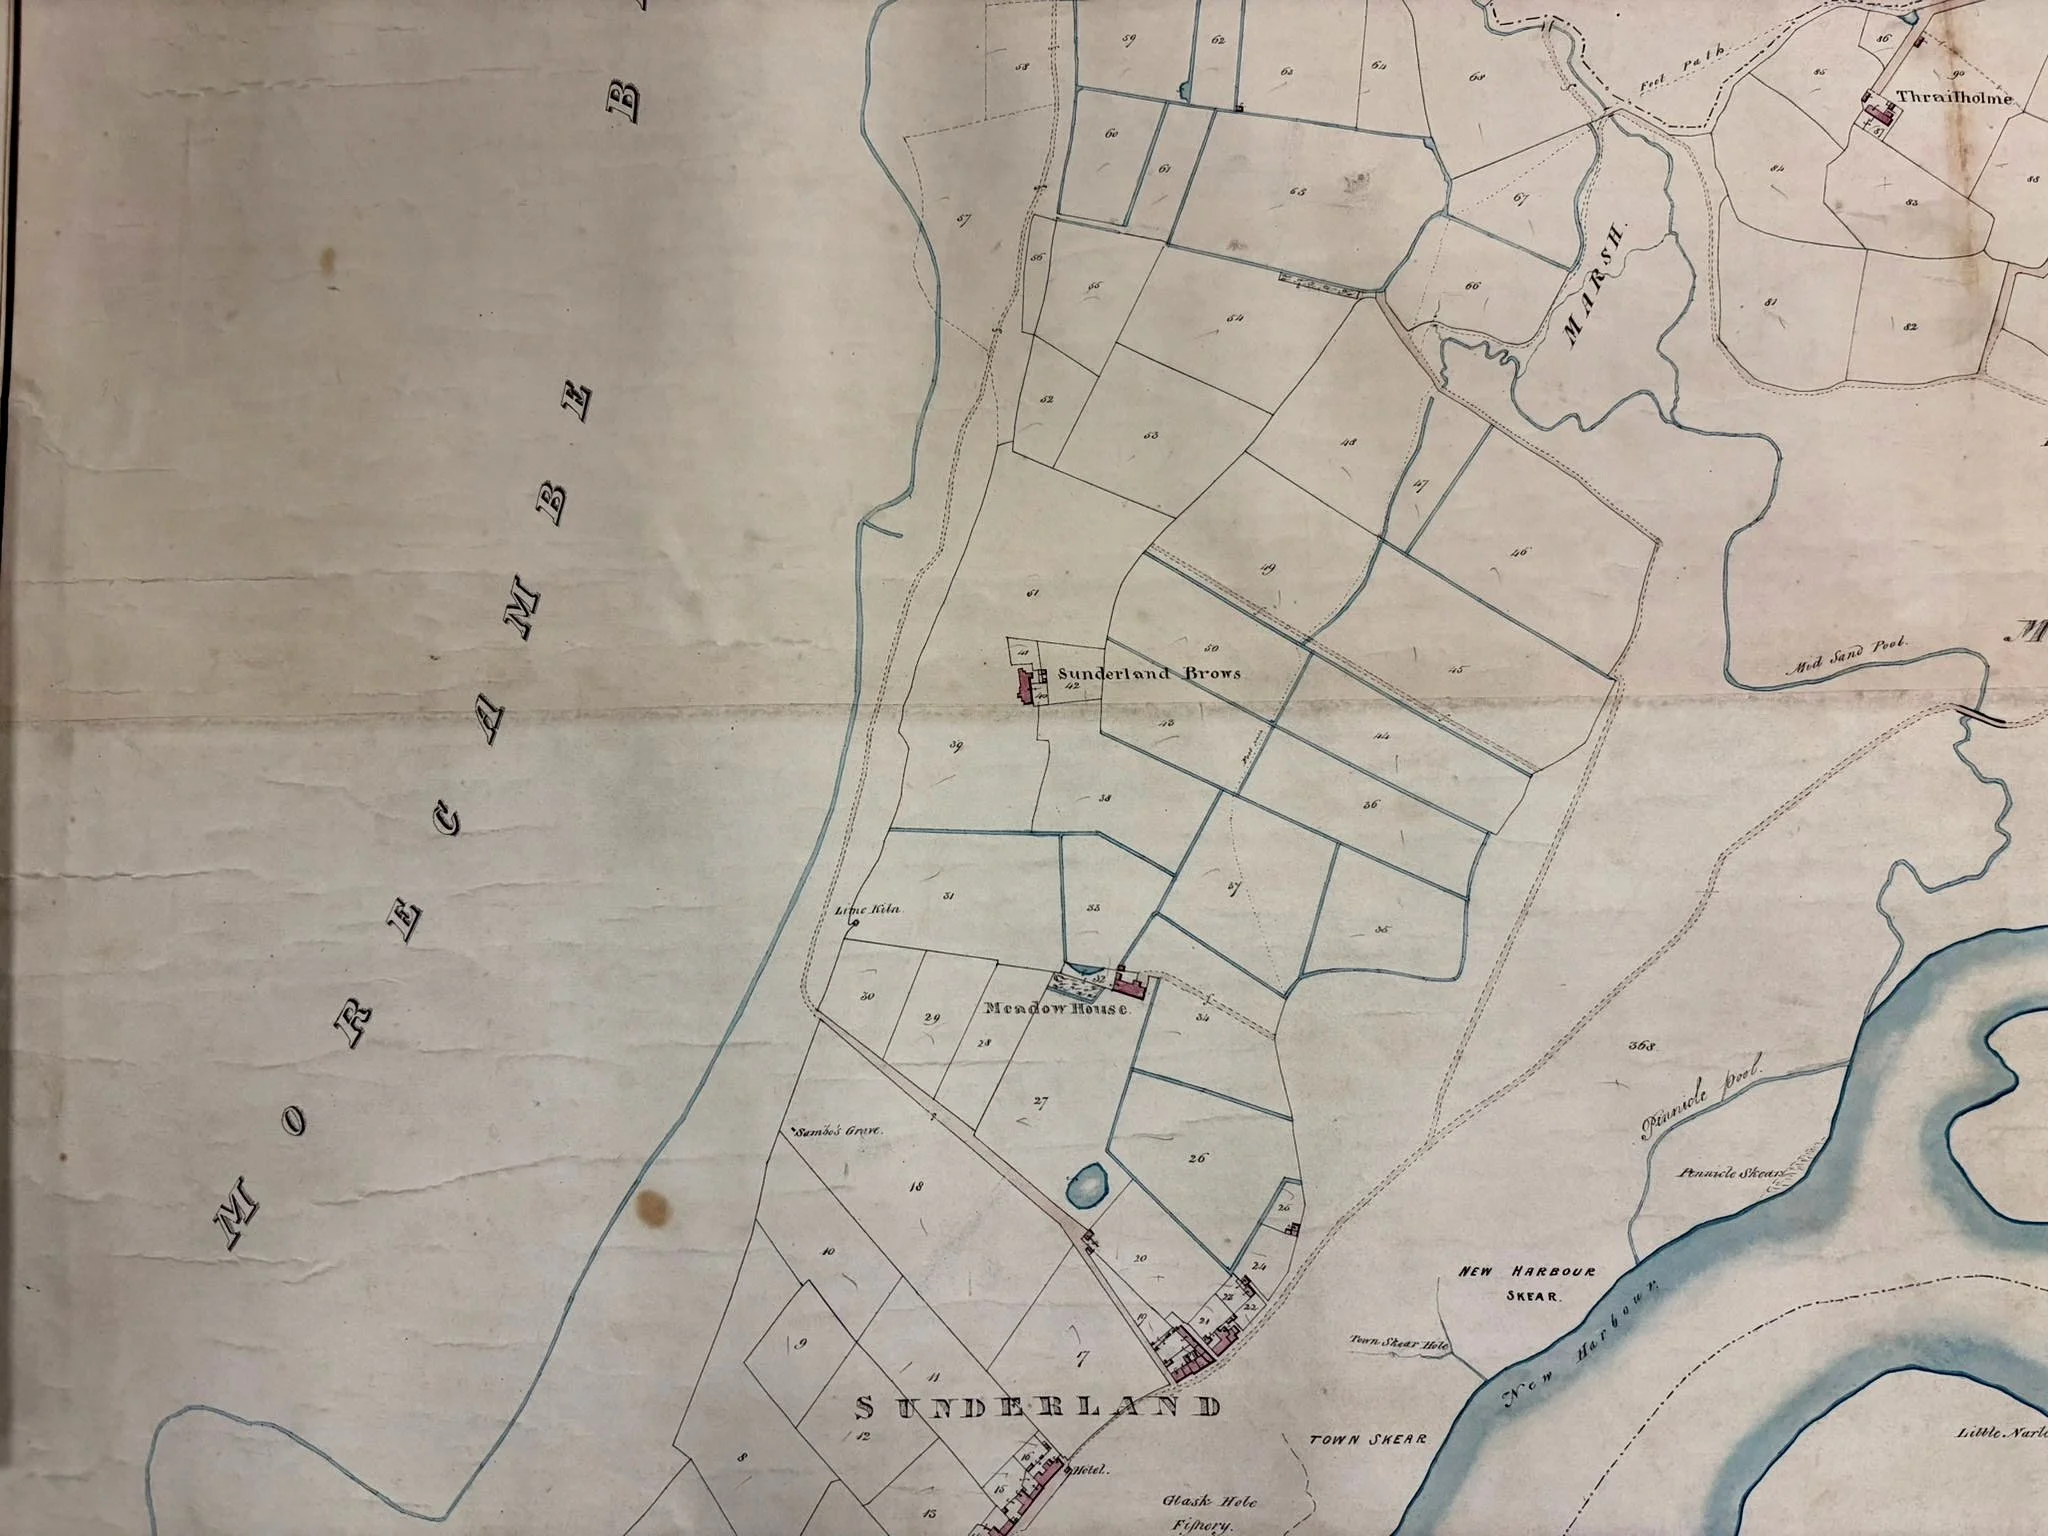
Extract from the Overton Tithe Map, 1844, Lancashire Archive Service DRB/1/145
Larger scale OS maps provide more clues in the form of place names. Carr Lane, Moss Lane, Trailholme, and Little Fylde (literally ‘little field’ but meant to convey its similarity to the heavily drained peatland around the river Wyre), all indicate a wet landscape. Even the name Sunderland suggests that the peninsula was more isolated than it is today.
It is not entirely clear which of these reclaimed lands were saltmarsh and which were moss. Indeed, Tudor land records make little distinction between saltmarsh, moss, and other types of pasture. The Tithe apportionment similarly groups together meadow with pasture, and marsh with sand. The positioning of the earlier embankment, from the top of Lades Pool, across to Trailholme, before turning southwest to West Shore, gives a good indication that the area behind it was subject to tidal inundation.
LiDAR surveys, a system where lasers are used to make a digital terrain model plotting tiny changes in ground height, can shed some light on this as they can show the sinuous paths of former saltmarsh channels. The LiDAR map clearly shows the straight parallel lines of the land drains used to dry out the fields, alongside the remains of these old channels.
These patterns suggest that all but the very highest parts of Sunderland Point were once wetland and that sea level rise or failure of the embankments could make them so again.
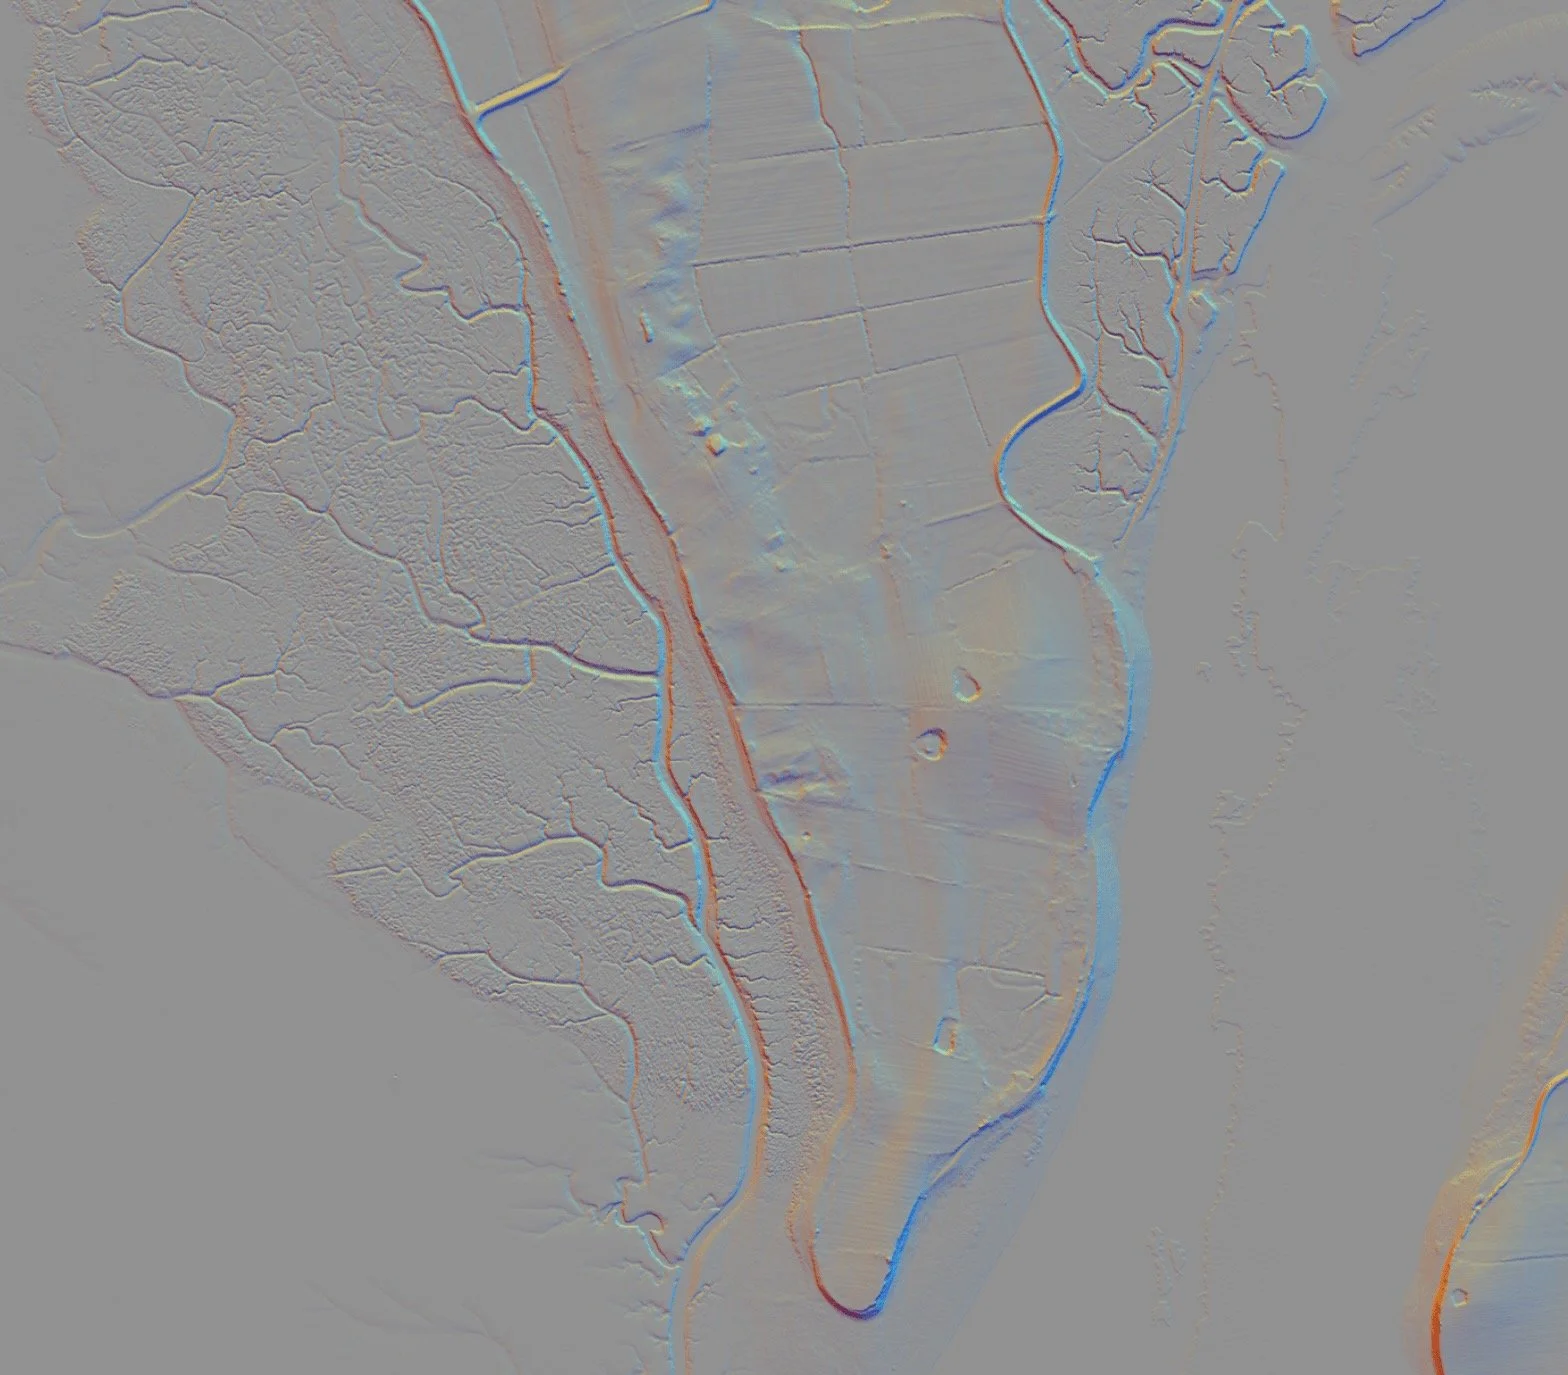
Extract from ESRI LiDAR Digital Terrain Model 50cm-1m, England. CC-BY National Library of Scotland
The history of the enclosure of saltmarshes fringing the river is better documented. The training walls in the Lune were designed for a dual purpose. Although improving the navigation of the river was the primary concern of the Quay Commissioners, it was always intended that the cost of the work would be offset by enclosing and selling the newly drained land the scheme created.
The most drastic version of this plan, came from coastal engineer W. Hague in 1840. He suggested that a ship canal should be cut between Lancaster and Poulton (now Morecambe) and the Lune diverted through it, then an embankment could be built across the Lune estuary and the riverbed drained.
This may have saved the Commissioners much of the trouble they had making the Lune navigable in later years, however, given the estimated cost was £500,000 (over £66m today) the idea was not taken seriously.
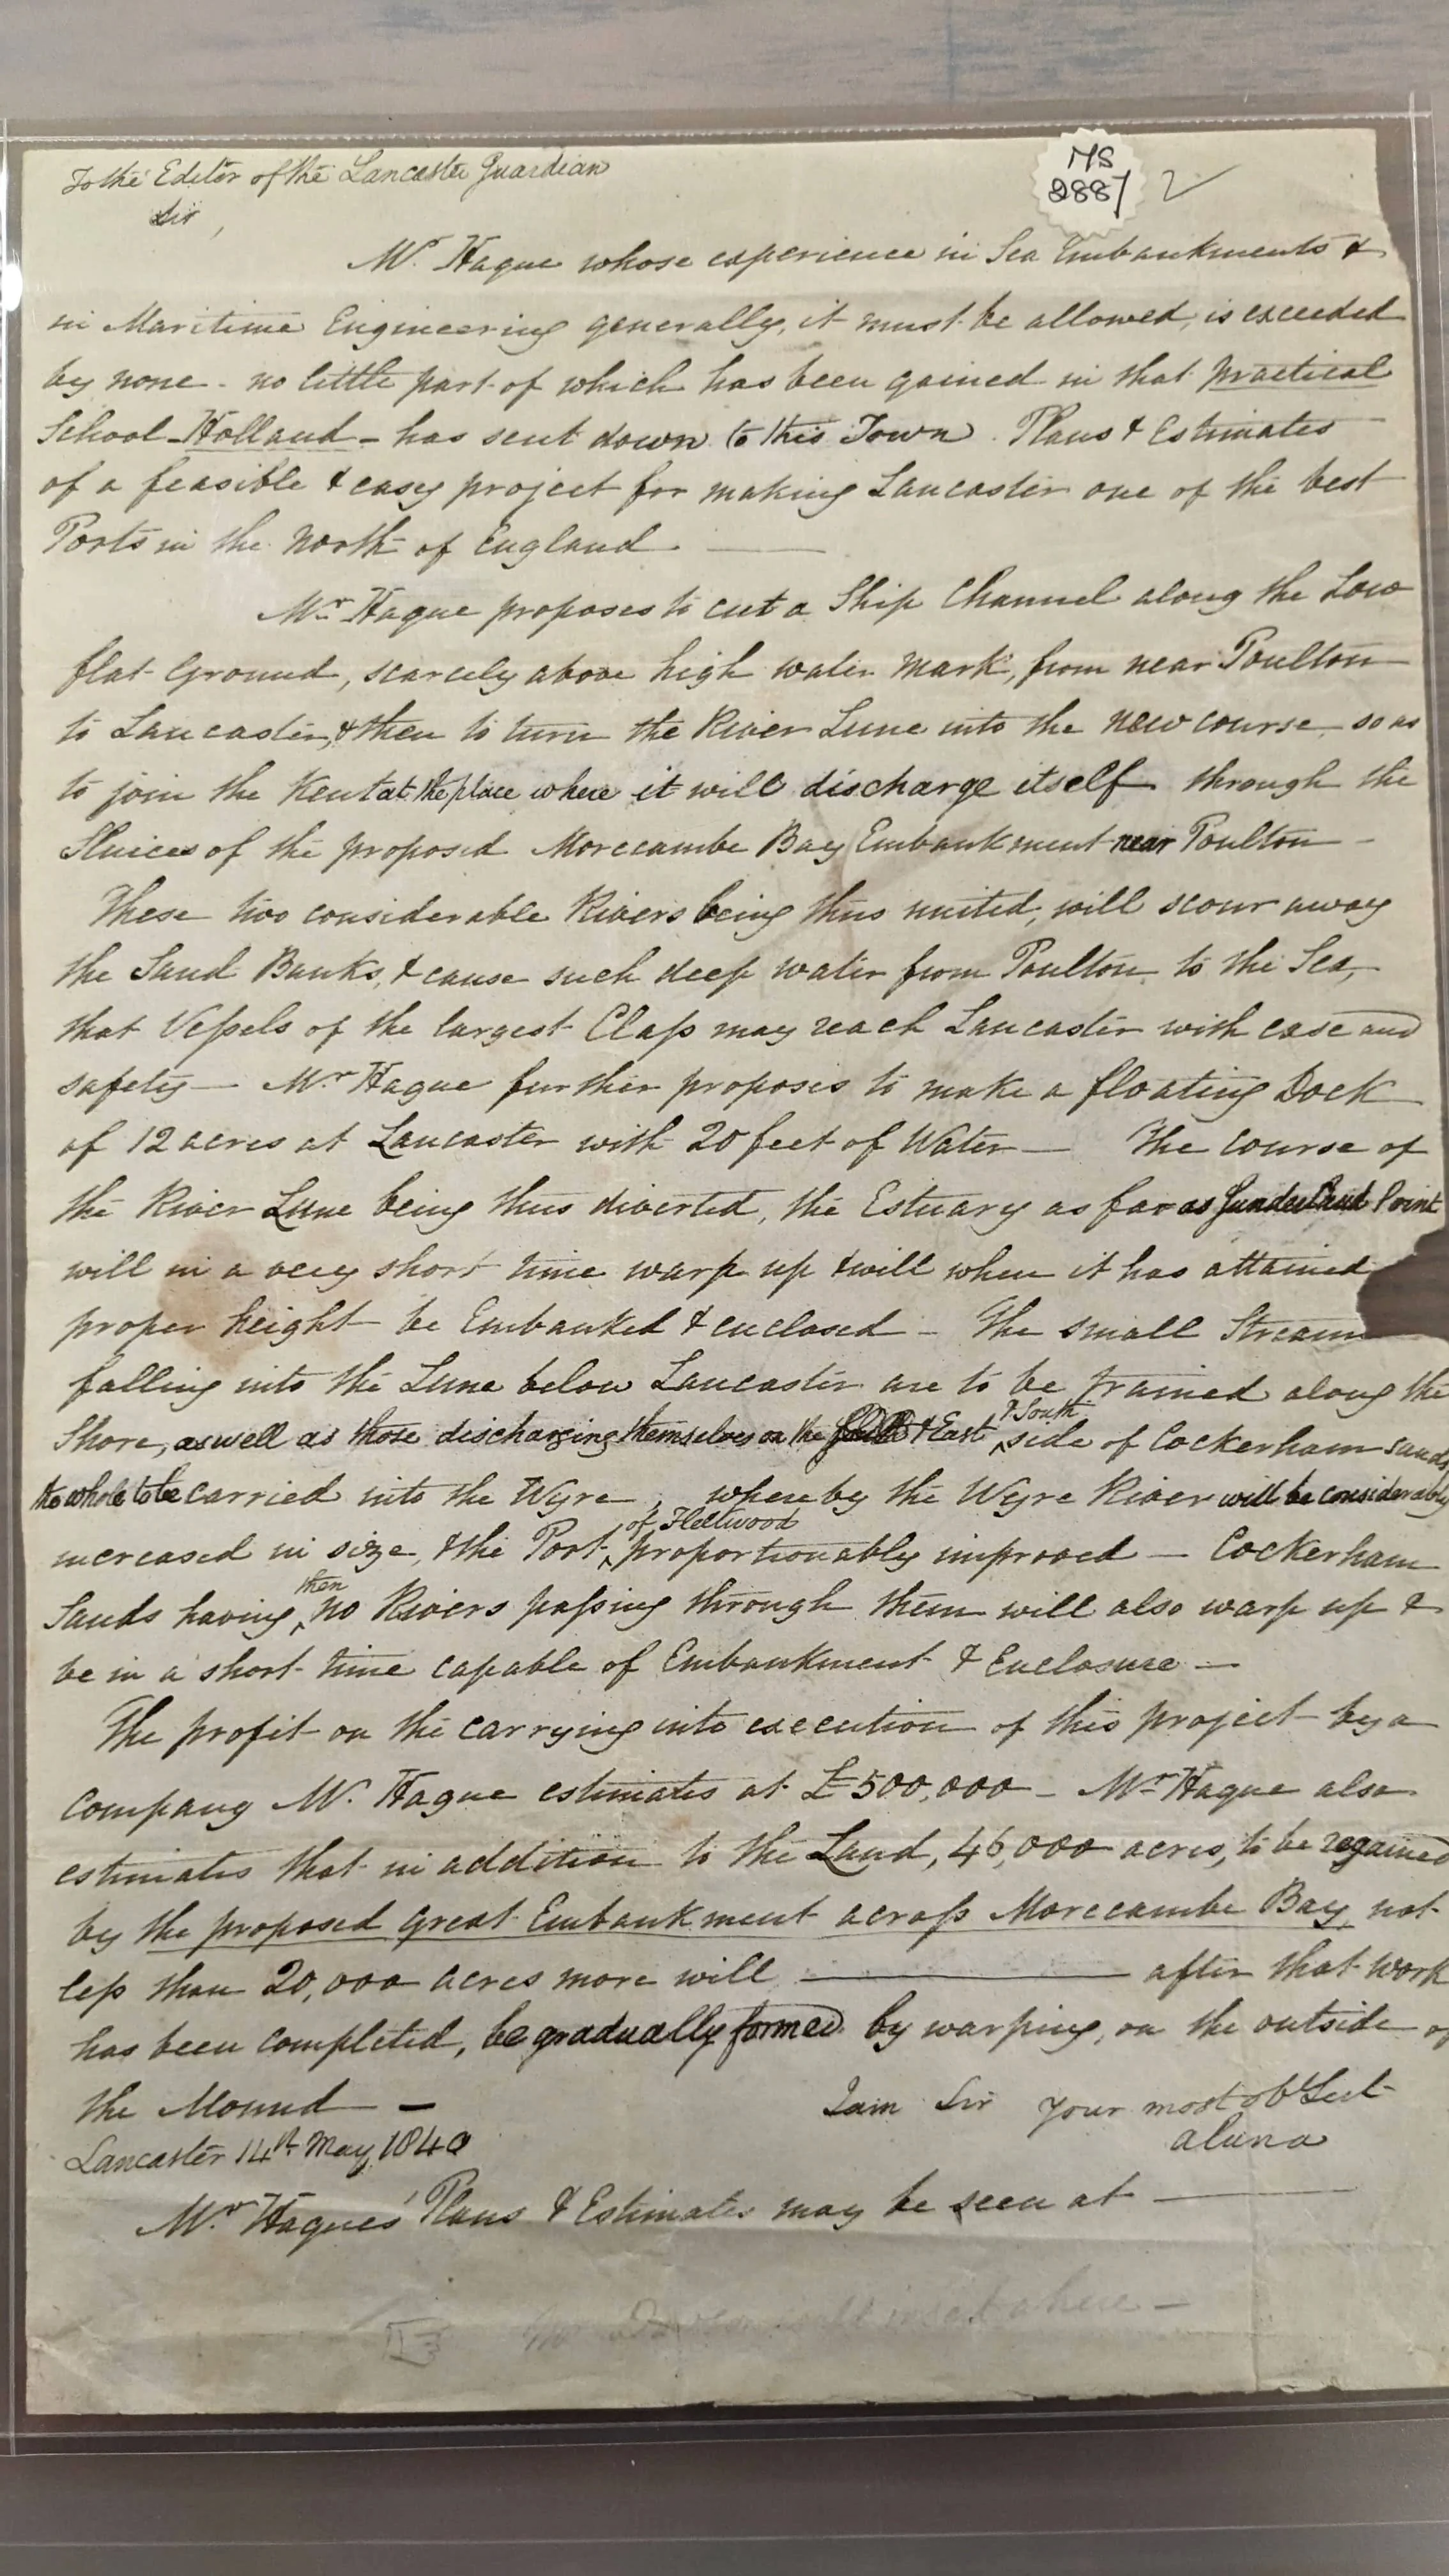
West Cumberland and Morecambe Bay Enclosure, Mr Hague’s plans, 1840. Lancashire Archive ServiceDDX2743/MS2887
As Hague’s plan was to eventually embank and drain the whole of Morecambe Bay, his scheme was unlikely to benefit the port long term.
While Hague’s plan did not come to fruition, many smaller scale enclosures of the Lune’s former flood plain were successful, before and after the building of the training walls.
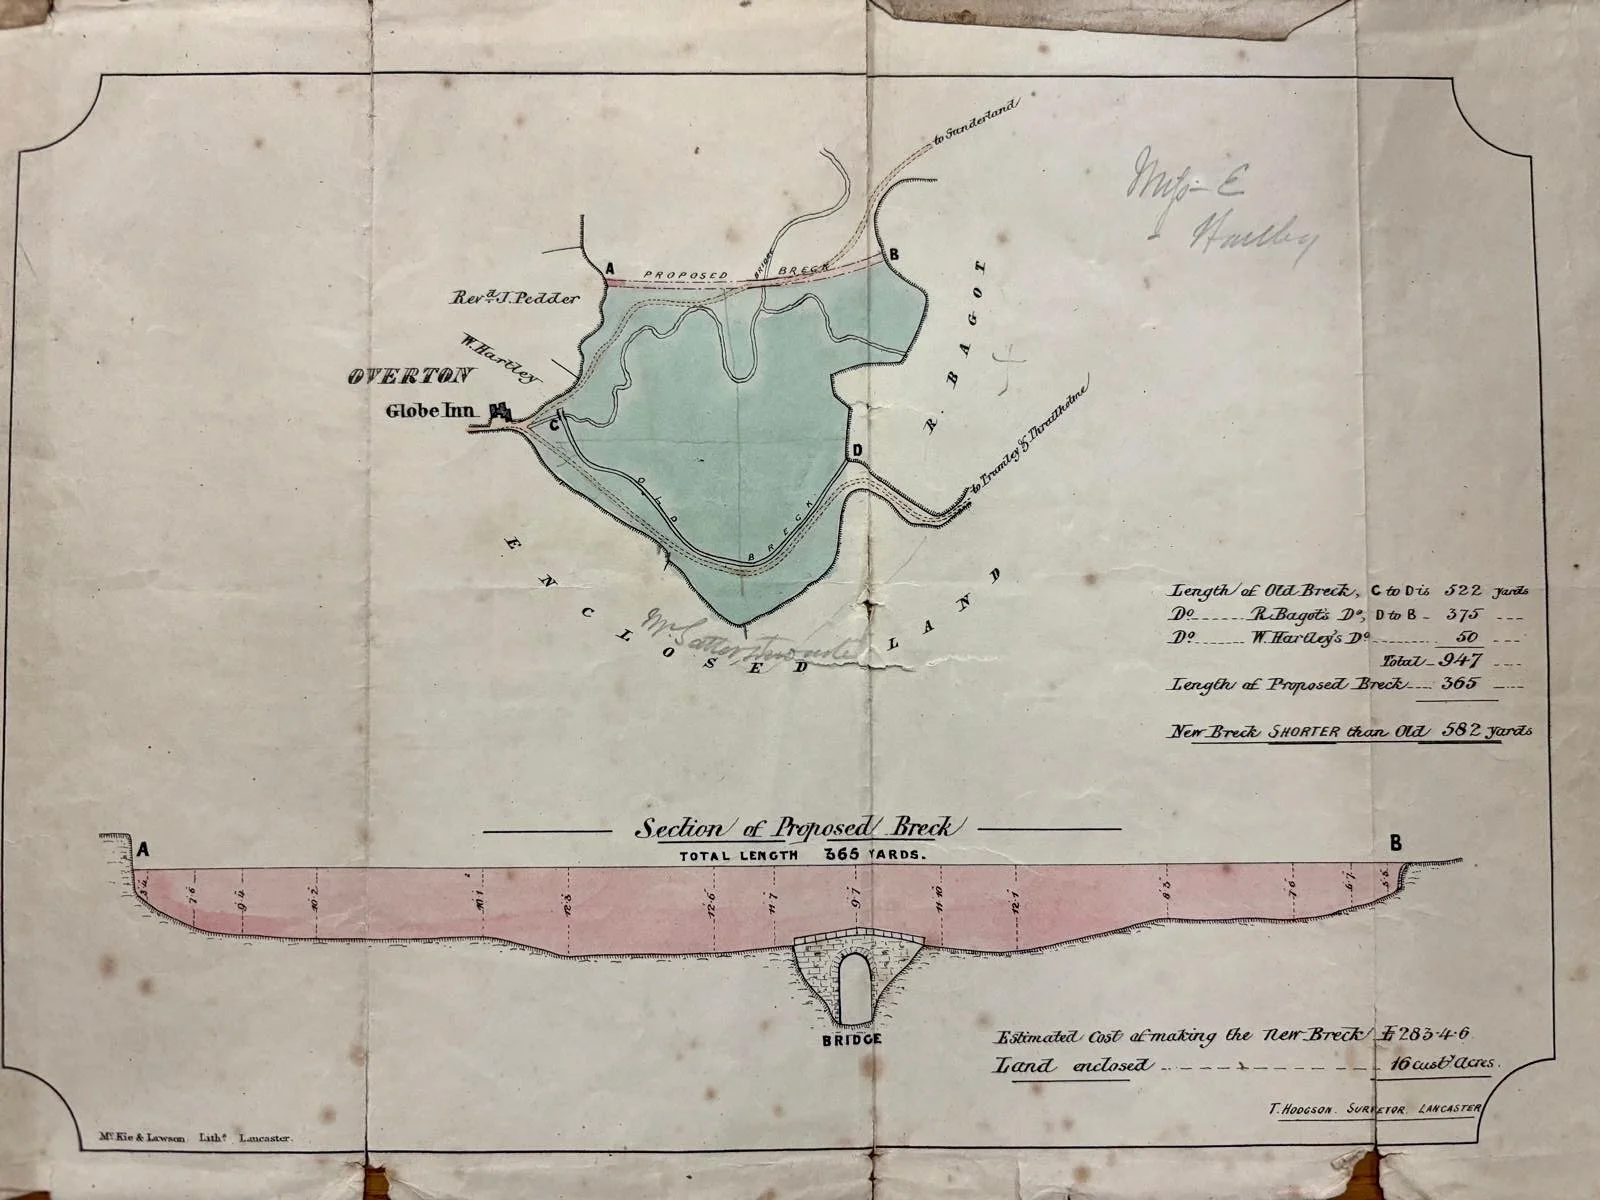
Map showing proposed reclamation of Lades Marsh, c. 1853. Lancashire Archive Service DDX1947
We have already seen that parts of Lades Marsh were being enclosed at the time of the 1848 OS map and were completed along the present line when the next map was published in 1893. Indeed, the works must have been complete by 1853 when Bazil Point landowner James Satterthwaite called a meeting to discuss the urgent need for the repair of the embankment to stop flooding of the land between Overton and Sunderland. The meeting also called for the construction of a new embankment, closer to the river, between Sunderland and Bazil Point, as shown in the map above (please note, the map was drawn with southeast at the top).
It is unclear why this plan was not enacted. Discussions between landowners continued until at least 1870, surveyors were appointed for the purpose, and a plan was approved by the Admiralty. According to the Lancaster Observer, by 1897 the embankment was once again in a state of disrepair which had caused the flooding of 150 acres of arable land.
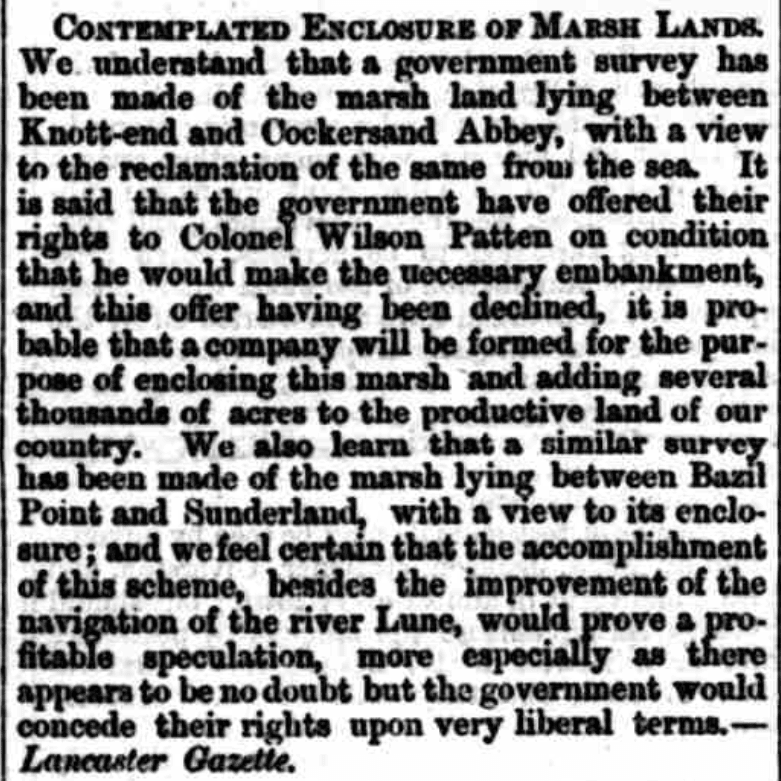
Newspaper article discussing contemplated enclosure of marsh lands, 29th December 1860, Ulverston Mirror and Furness Reflector
Prior to Stevenson’s plans for training walls in the Lune, his scheme for deepening the river closer to Lancaster involved embanking marshland at Ovangle and Colloway. Although these marshes did expand rapidly in the late 19th century, they had only been partially enclosed by 1931.
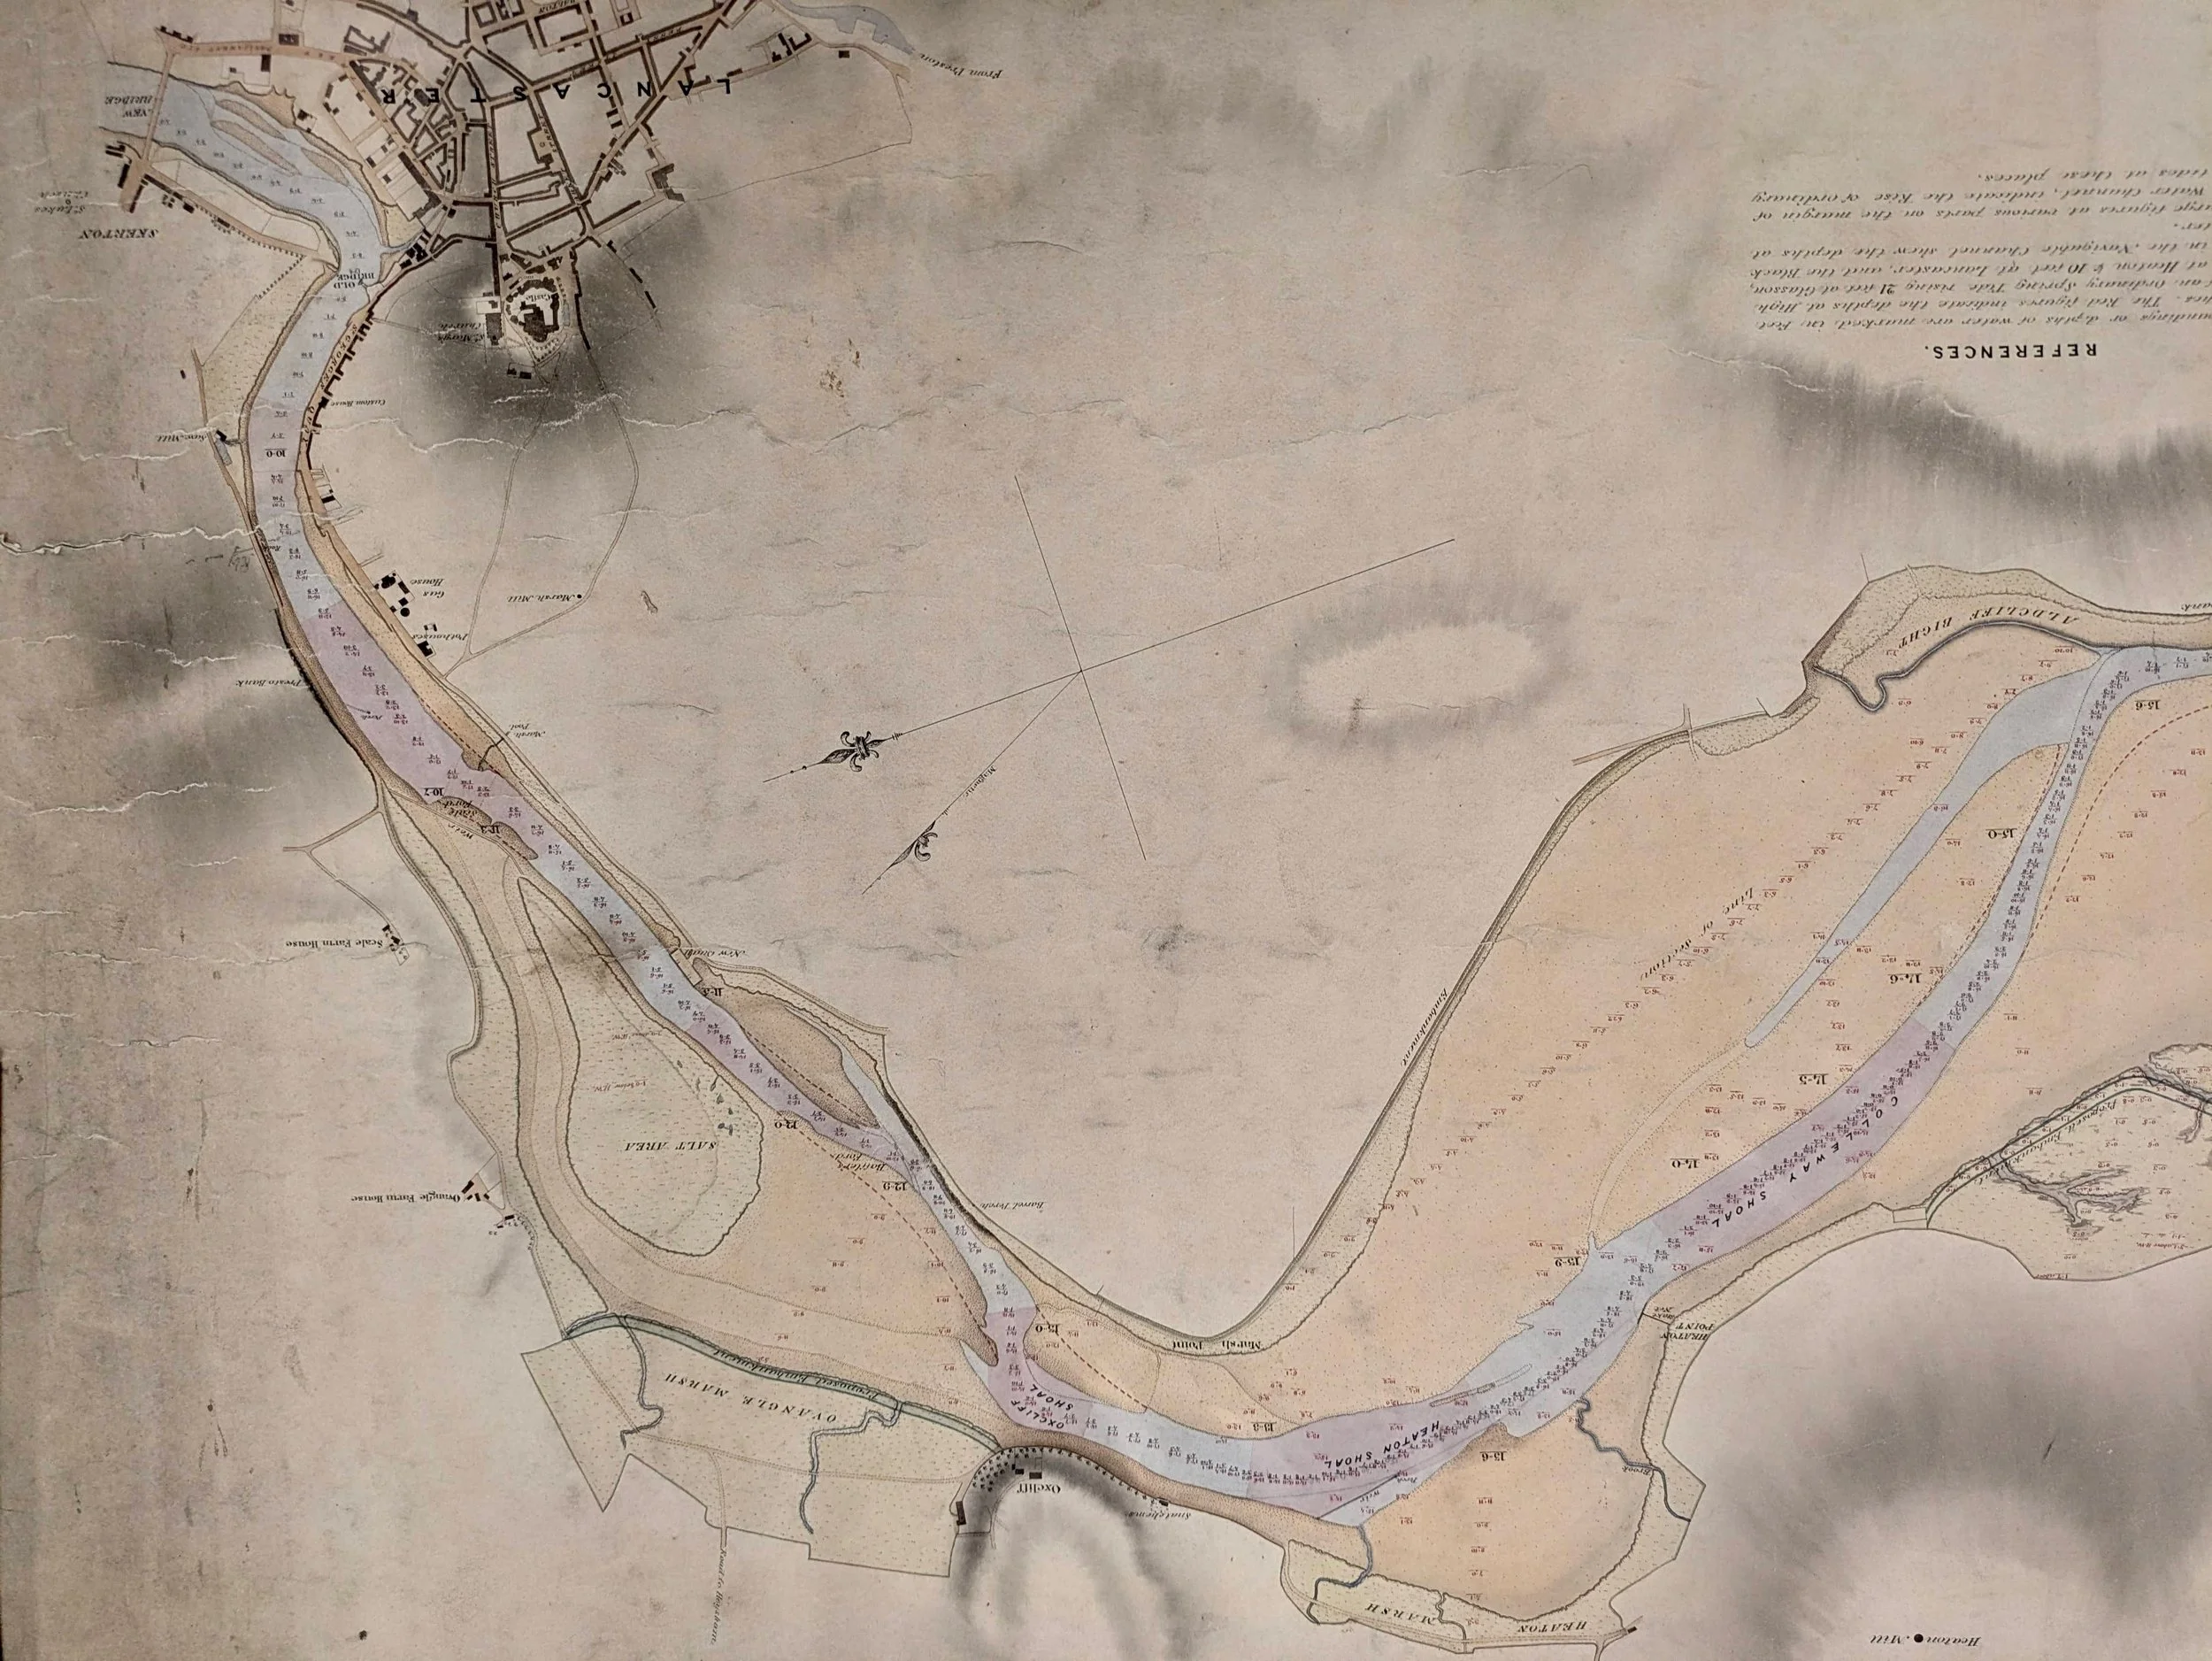
Extract from Stevenson’s depth survey of the River Lune from Lancaster to Glasson, 1838. Lancashire Archive Service NWW/1/2/4.
Historical evidence shows that both natural processes and human interventions have significantly changed Sunderland Point. Some changes, including saltmarsh growth and embankment construction, have reduced flood risk, while others, such as large-scale drainage schemes and river training walls, have increased the peninsula’s vulnerability to rising sea levels.
We have also found inspiration in these sources, for possible techniques to encourage saltmarsh, methods of managing shellfish to create stronger skears, and for ways to adapt to frequent flooding in the furnishings we choose.
Download the full report to read more of Sunderland Point’s history and for a list of the sources we consulted.
About the author
Claire works as the Archaeology and Heritage Officer for Morecambe Bay Partnership. She has been delivering research, training, and education programmes around Morecambe Bay since 2020, covering early prehistoric footprints, Second World War defences and everything in between. She has a passion for sharing the stories of past people and making heritage accessible to everyone.

Claire Bradshaw
We are very grateful to Claire for taking the time to produce this special article. The full report is outstanding and contains much new information and includes the results of original research into primary sources.
Next week, the building of Dolphin House from 1912 to 1914. From the original designs to the finished building, captured in photographs and images.