Climate Change
Climate Change
The Sunderland Point Community Association was founded by residents who shared a deep concern over the damage to their homes and the fabric of the Point caused by repeated and serious flooding.
This was reinforced by the knowledge that public policy had declared there would be ‘no active intervention’ to provide any major flood defence infrastructure. Over the last number of years much has been done by combination of the Community Association, the Gilchrist family, and the Environment Agency to provide flood defences for homes and larger projects to protect the land.
With climate change bringing rising sea levels it now becomes an issue of the greatest concern.
The clock is ticking. It is literally only a matter of time before the Point becomes uninhabitable as serious flooding becomes a regular occurrence.
But When?
The Met Office has published data showing that global rises in CO2 levels have caused an increase in world temperatures of almost 1-degree Celsius.
Warming temperatures increase sea levels in the following ways.
Main Contributors – the melting of ice reserves:
The Antarctic ice sheet.
The Greenland ice sheet.
Glaciers
And through:
The thermal expansion of the ocean
The evaporation of water stored on land falling as precipitation into the seas.
A chart published by the Met Office suggests that at our current rate of CO2 emissions, we could expect sea levels to rise by almost a metre in the coming 100 years. To see the chart follow this link The Met Office provides comprehensive climate change information to read more follow this link
Closer to home, projections compiled by Climate Central, an independent group of scientists and communicators, show an increased risk of flooding in North West England by 2050, less than 30 years from now. The area shown in the red will become vulnerable to potential flooding on an annual basis rather than multi-year.
Which means, a rare flood event today will be commonplace by 2050. The land around Morecambe and even Lancaster is one of many areas in Britain potentially effected.
Land in North West England most susceptible to repeated flooding by 2050
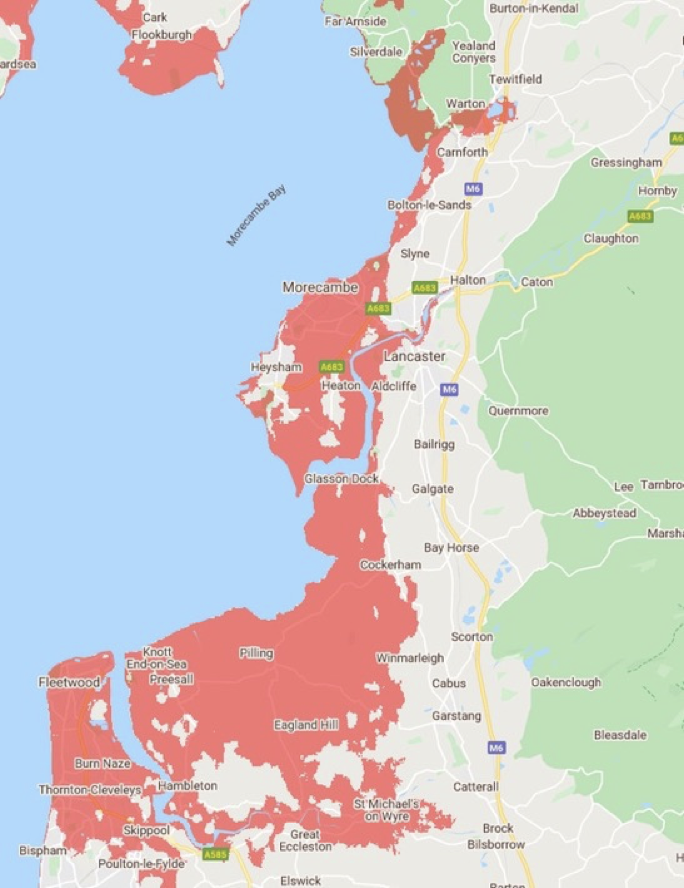
Source: Climate Central 2022
Even closer to home we can see that sea levels are rising and have been for many years.
Relative Sea Level Trend: Heysham UK

Source: National Oceanography Centre: Permanent Service for Mean Sea Level
The chart above shows the sea level change at Heysham just two miles from the Point, it is currently averaging 2.38mm per year. Or 14.4 centimetres between 1960 and 2020
Environment Agency
We wanted more detail to understand the effects of climate change at Sunderland Point and approached the Environment Agency (EA). They supplied detailed information and engaged in dialogue on the current and future flooding risk at Sunderland Point.
We received from the EA a data set of nine maps for the Point based on the existing sea defences. Six of the maps showed the risk of floods in the present day and a further three to include the future effect of climate change on rising sea levels.
This is one of their charts from that data set. It shows the extent of flooding in a ‘once in 100 years’ storm event that could occur in the current era. Storms of around this magnitude have occurred in 1907 and 1927 and even worse in 1977 (Click here for link to Flooding page)
The impact on the Point is clear - both Terraces are flooded and the lower lying central area of the Point is underwater from coast to coast.
Chart supplied with the permission of the Environment Agency
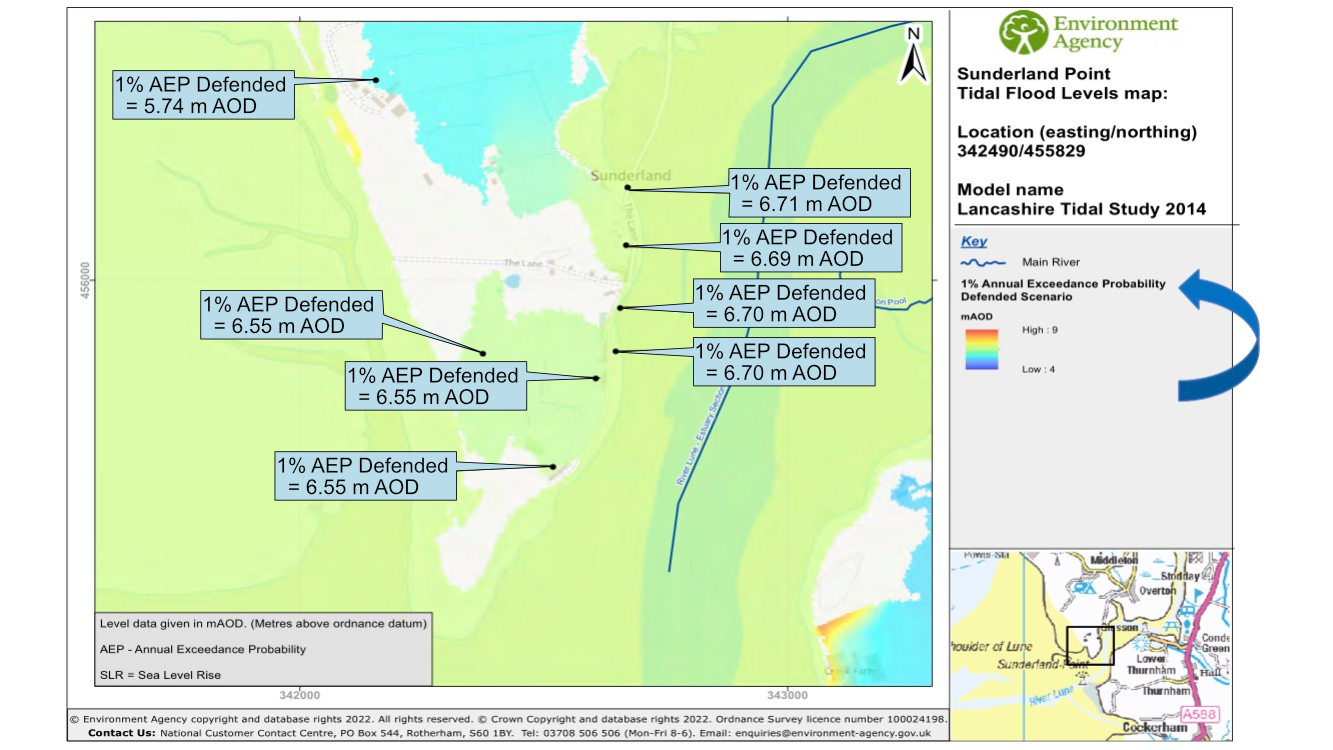
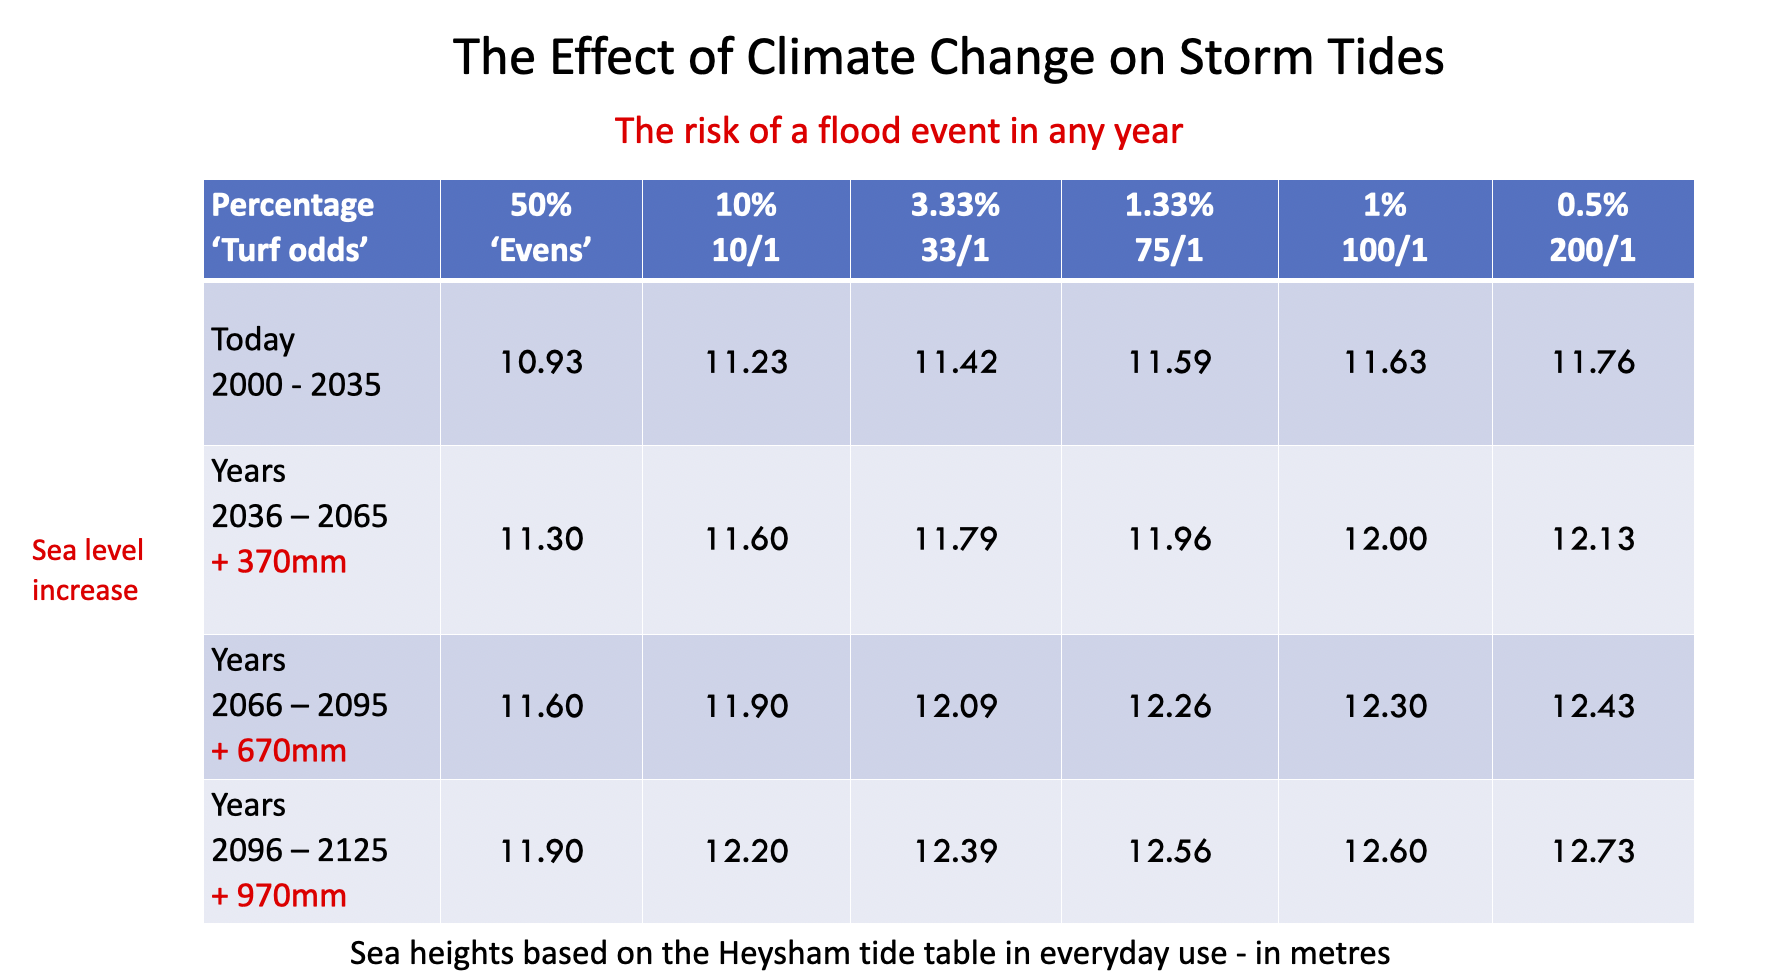
To help clarification - in the chart side bar (see our blue arrow) it says ‘1% Annual Exceedance Probability’ this means in any year the risk is one in a hundred. Not very high but the effect is severe. The blue boxes on the chart show tide levels reaching an average 6.7 metres ‘above ordnance datum’ on the Terraces. Putting this In chart depth (at Heysham) - the more familiar term - it would be 11.6 meters. A very big tide!
The Environment Agency also provided this prediction for sea level increase directly at Sunderland Point - see below. It is based on four 30-year periods up to a century ahead - to 2015. The tide heights will increase by just under one metre in the coming 100 years. An increase of around 10% on current levels
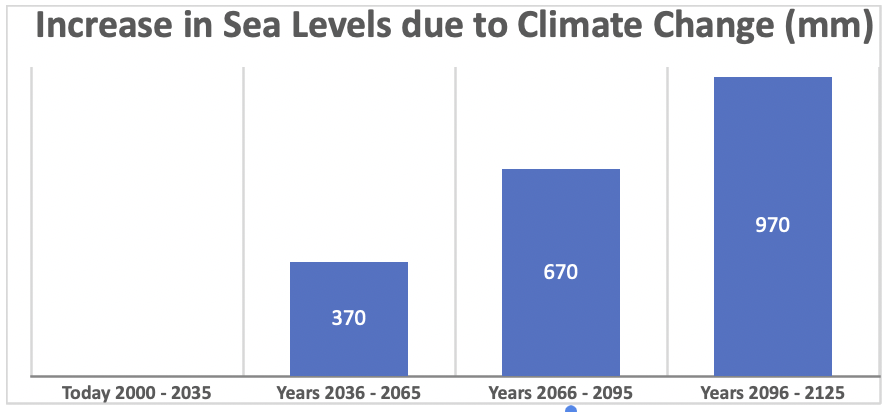
Predicted increase in Sea Levels in millimetres at Sunderland Point based on information supplied by the Environment Agency
This is before considering the impact of storm conditions when low barometric pressure and strong south westerly winds combine to create a storm surge.
This next chart summarises the longer-term EA predictions. Across the top is the degree of risk in percentages, with ‘Turf odds’ added to aid understanding. On the left column are the four, 30-year periods, with the sea level increases driven by climate change included.
As the degree of risk falls the severity of the flood event increases
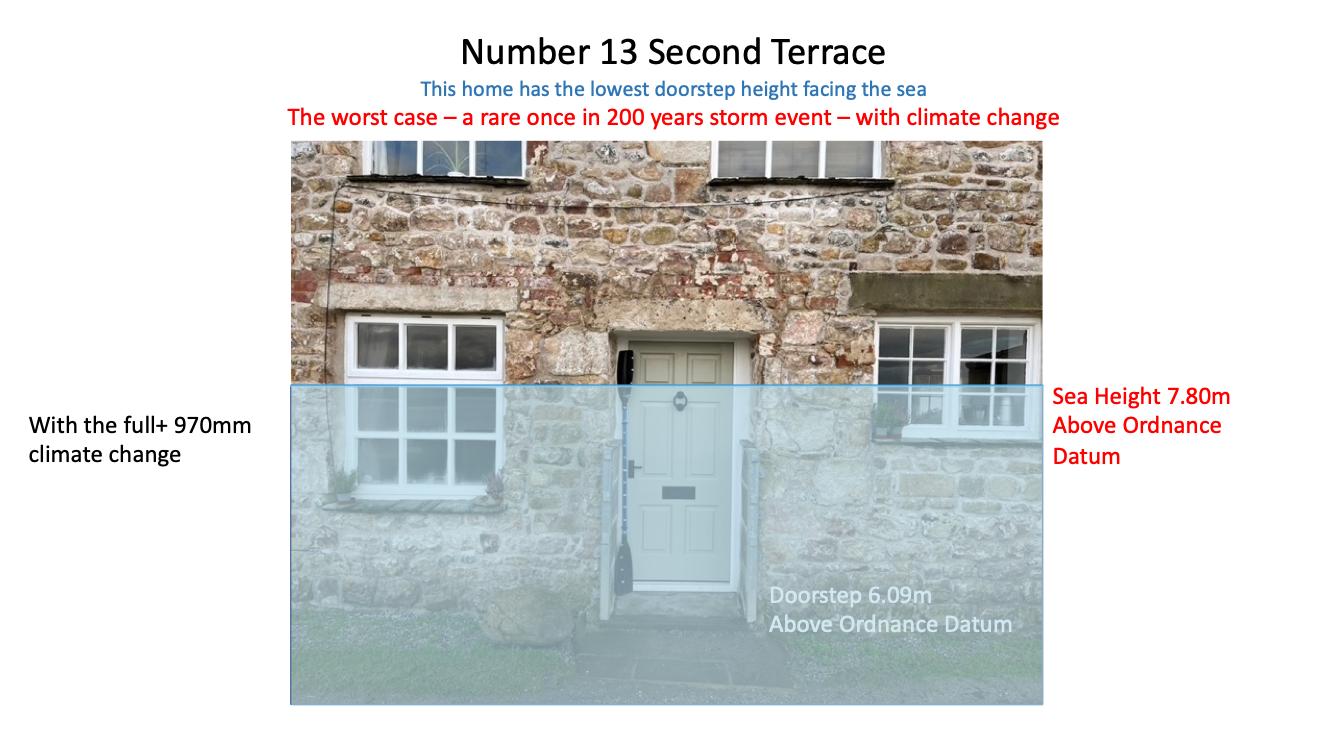
Using this Environment Agency data set and moving forward a century or so to the worst-case scenario, we look at the front door of number 13 Second Terrace. This home has the lowest door step height facing the sea. Knowing that height calculated where the ‘still water’ level of the flood tide would reach.
It would be a once in 200 years violent storm event, low risk but very high impact.
But what of everyday living - how would that change? Of course, the tide would cover the road for much longer periods but what of floods?
This next chart looks at the high risk but ‘lower’ impact storm event. These are storms experienced every other year or so - a 50/50 chance. A frequent event.
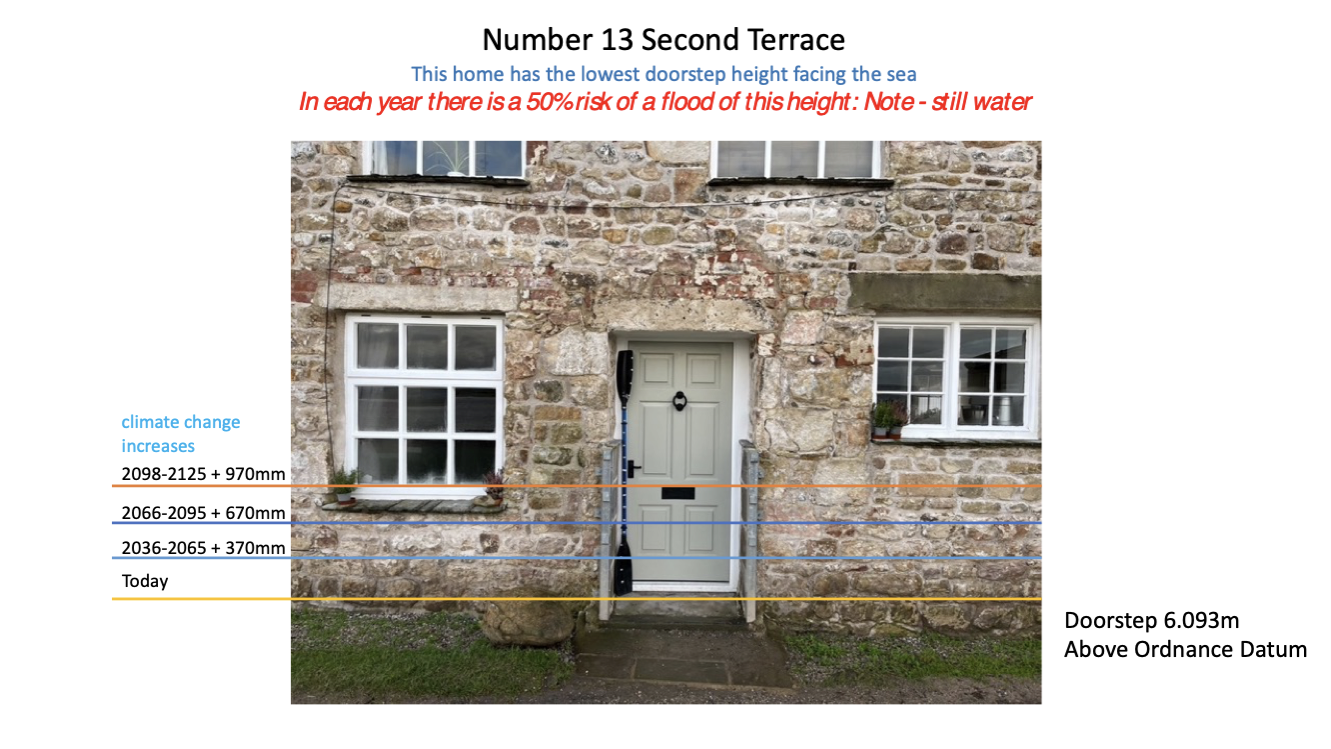
Look at the first line, the sea does not quite reach the doorstep, 30 years from now the 50/50 flood tide is well above the doorstep. 60 years from now a third of the way up the door and in 90 to 100 years or so from now, almost halfway.
This would be the common year by year experience. And this is ‘still water’ in storm conditions as this photograph from 2013 at the front of number 13 shows, the water is far from still.
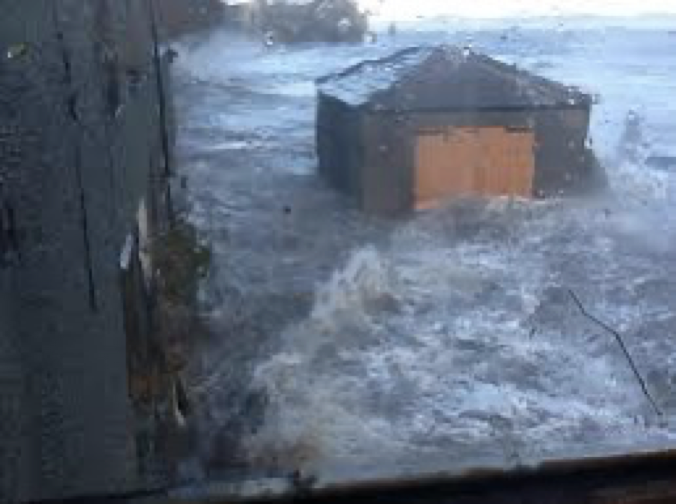
Image from the collection of Lynne Levy
For more photographs and information on past flooding follow this link.
This latest information from the EA adds to our flooding knowledge. We will continue to work together in partnership with all stakeholders, as we develop our future plans and tactics to defend our vulnerable residents, our homes, our way of life and our heritage
Click here to return to the environment home page
Or, to return to the first page in this folder ‘The Tide’ click here