The Tide
The BBC Tide Page
You can get a clear idea of the state of the tide, at Sunderland Point, for today and the next 6 days by going to the BBC tide table for Heysham
The tide display explained

Path in BBC Website
Tidal information is stored in the BBC Weather page under ‘Coast and Sea’. So this text shows you where you are in the website.
Port to which diagram refers
The port of Heysham is the closest to Sunderland Point and so the tide details closely match the tide on the River Lune at the Point.Situation summary box
This box tells about the tide state at the current time. At the top it says whether the water level is rising or falling.
Below that, you are given the time until the next high tide and also the time at which it will happen. (GMT is Greenwich Mean Time)
Similarly the time until the next low tide and the time it occurs are given to the right. All of this information is updated in real time.Day selection
When the page is first opened the day selected is ‘Today’. You can however select any day in the 7 days beginning today by clicking on that day in the row of days displayed here.
Each day is shown with its date below. If Today is selected, the current time marker is displayed on the tidal curve.High and Llow tides detail
There are normally two high tides and two low tides in each day. This table shows the times of the high and low tides for the selected day.
The height of water at the high tide and low tide is displayed in the right hand column of this table. Tidal heights are very important as they will determine when and if your car, with you in it, will float away when crossing the causeway.
Tide heights are measured from ‘Chart datum’ which is the Zero for Seafarers. Chart datum is the average value of the lowest tides over a long period of time at Newlyn in Cornwall.Water level graph
The change in water level over the day is shown as the blue line of the graph. The vertical axis shows the predicted height of water at a particular time. The horizontal axis shows the time of day starting at midnight (00:00hrs) at the left hand end. If you are looking at ‘Today’, a bulls-eye icon shows the current time superimposed on the graph.If you hover your cursor over any part of the curve, a value of the tide height and time will appear over the top of the graph.
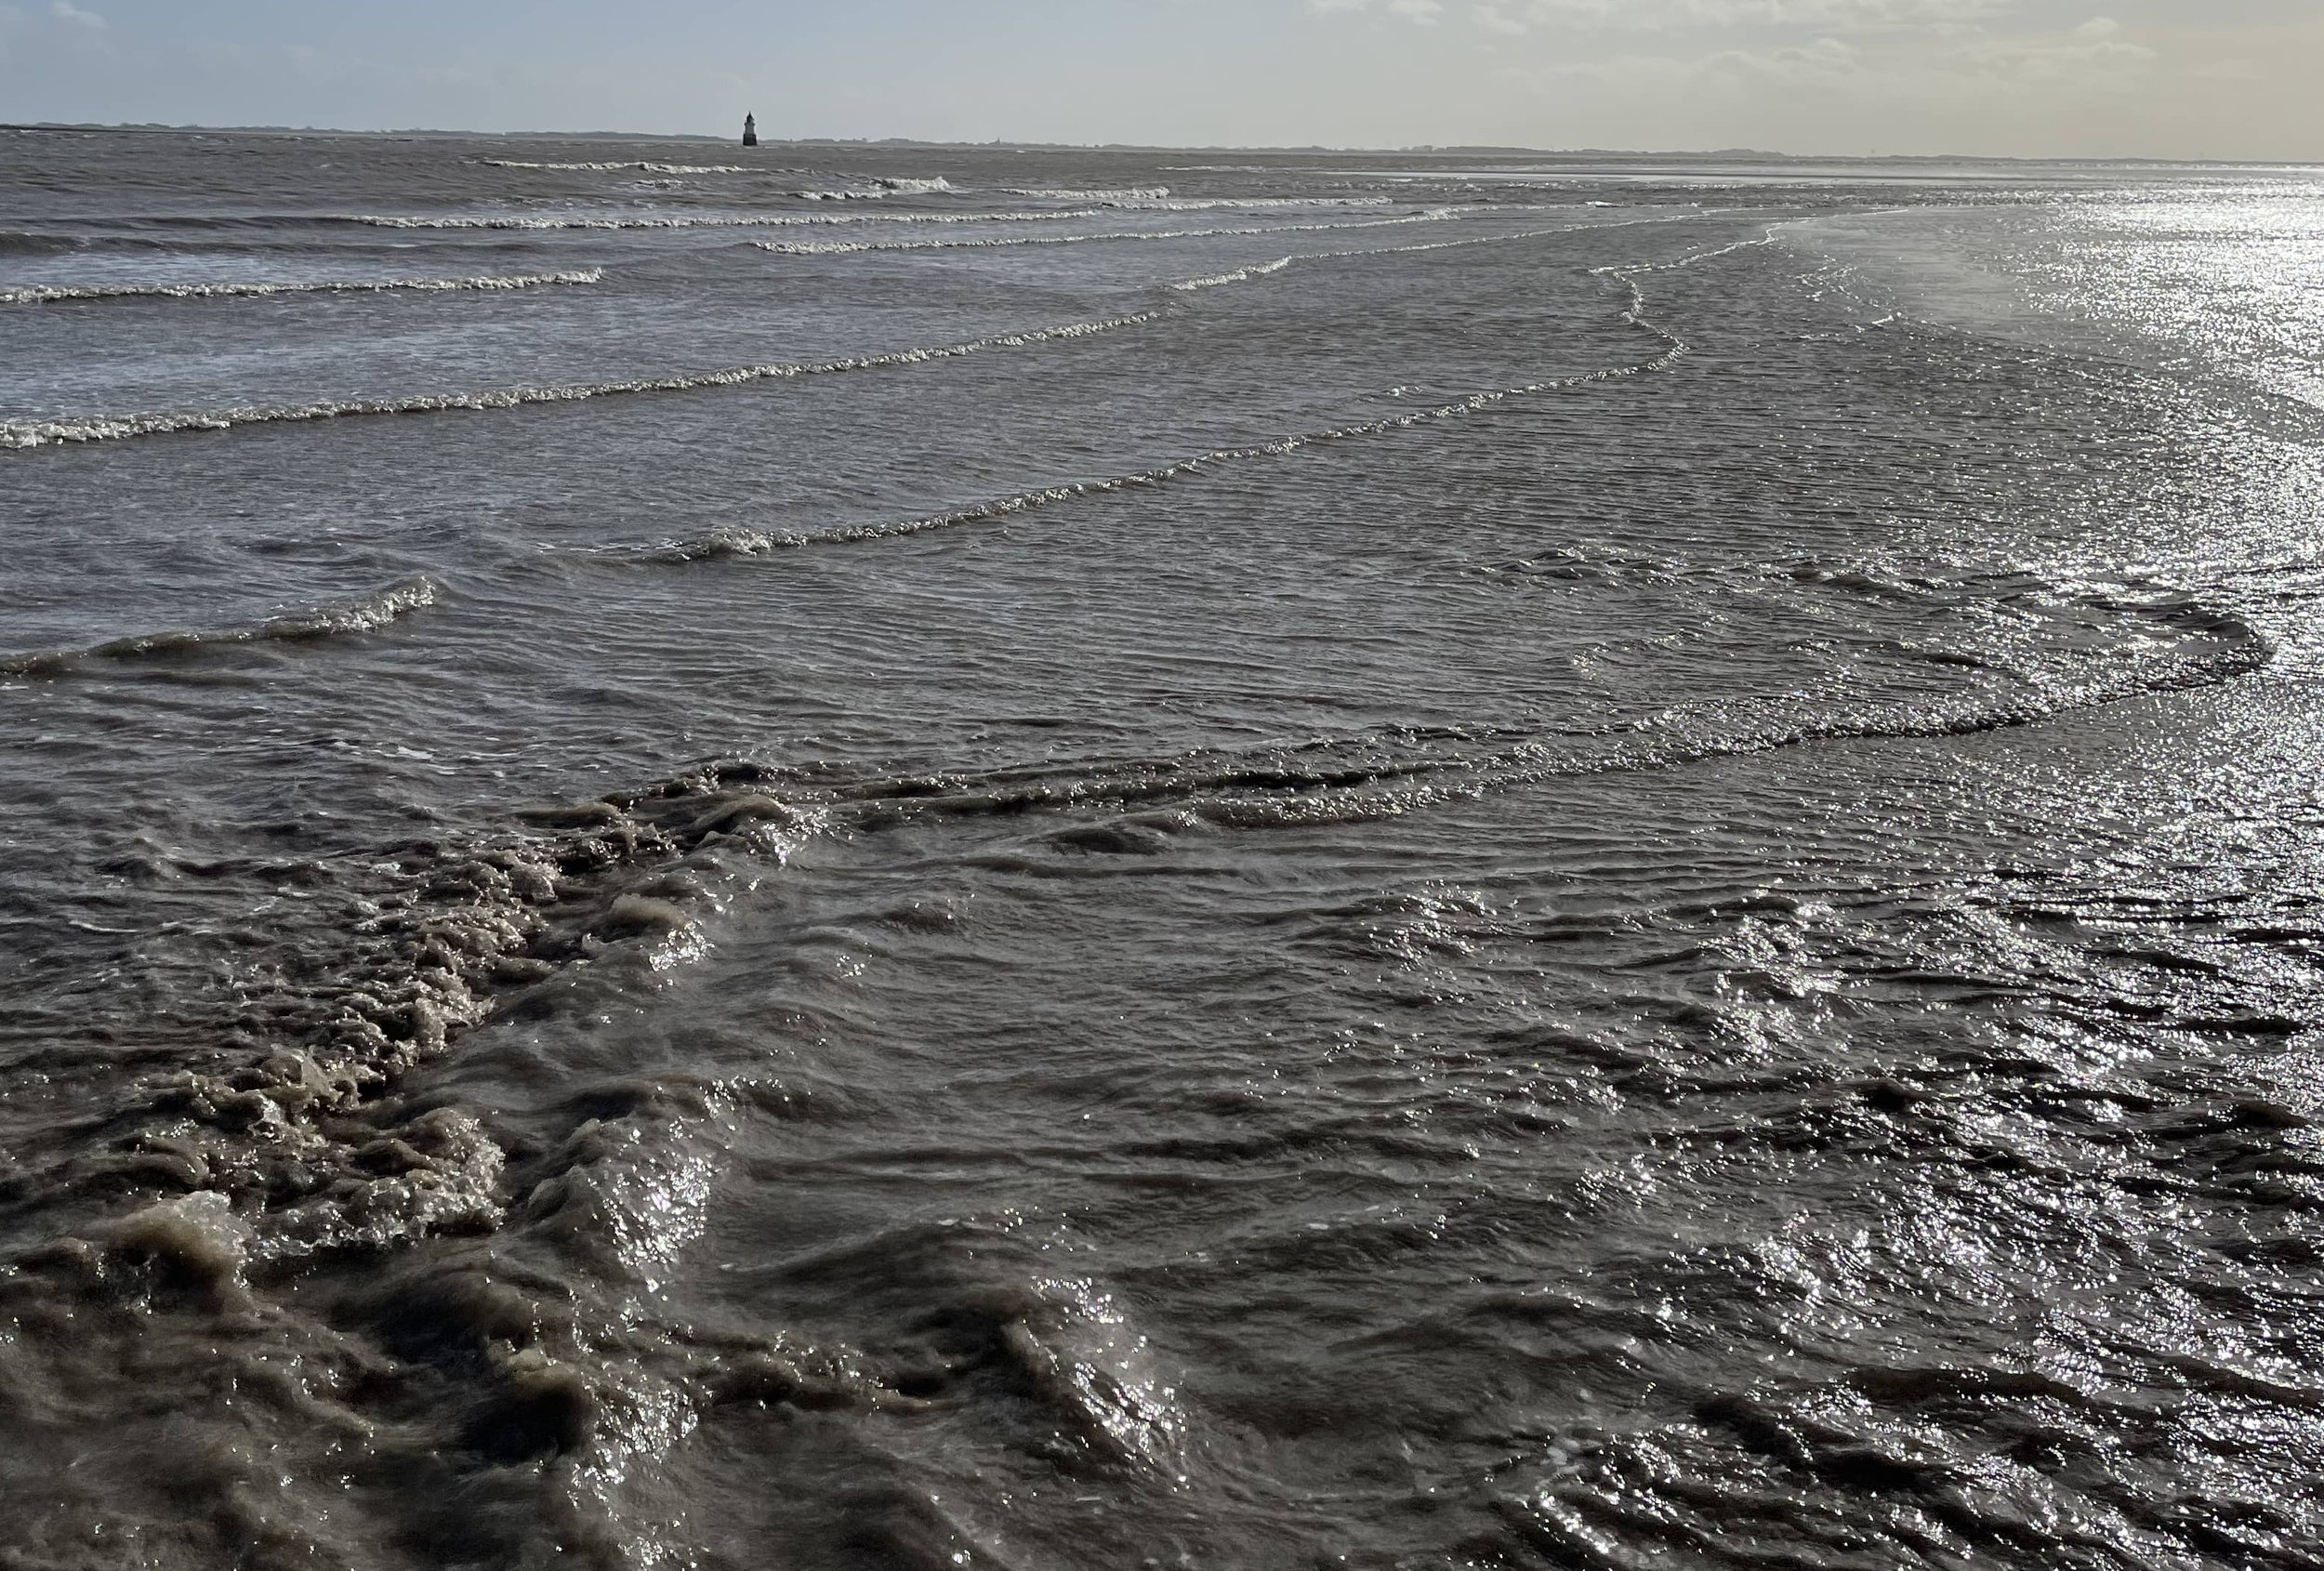
Looking towards the Point with the tide covering the causeway: From the collection of Alan Smith
Springs and Neaps
The height of the high tide varies during the month due to the position of the Sun and Moon in their orbit around the earth. Very high tides occur when the Sun and Moon align on one side of the orbit or on opposite sides of the their orbit. These tides are call ‘spring tides’ or just ‘springs’. Spring tides occur twice each (lunar) month and can cause flooding of the roads and sometimes houses on the Point. Spring tides closely follow a New Moon or a Full Moon and always occur around midnight or midday.
Neap tides have a smaller high tide. Neap tides occur about 7 days after a spring tide.
During the tidal (lunar) month there will be a spring tide followed (about 7.5 days later) by a neap tide, then (about 7.5 days later) another spring tide and then (about 7.5 days later) a neap tide!
See the magazine article ‘Time and Tide’ for a fuller explanation.
Big tides
The height of the tide varies during the month and the year. The lowest low water is about 0.6 m and the highest high water about 10.3m. Tides over 9.5m are counted as very high by the residents of the Point. Recently (Thursday 23 March 2023) a spring tide of 10.1m occurred just after midday at 12:12pm. This followed a New Moon on the previous Tuesday. No damage or flooding was caused by this tide although residents certainly put up the tide boards. Luckily the weather was kind and the day calm. It is a different matter when there is a storm to the South-west. High winds force water into the funnel mouth of the Lune estuary and a seemingly innocuous tide becomes a serious threat. The ground on the Point is made of sand and alluvial debris, and is quite porous. Some of the buildings have cellars below ground level, a big tide can cause flooding of cellars when water comes in through pores in the sub-soil.
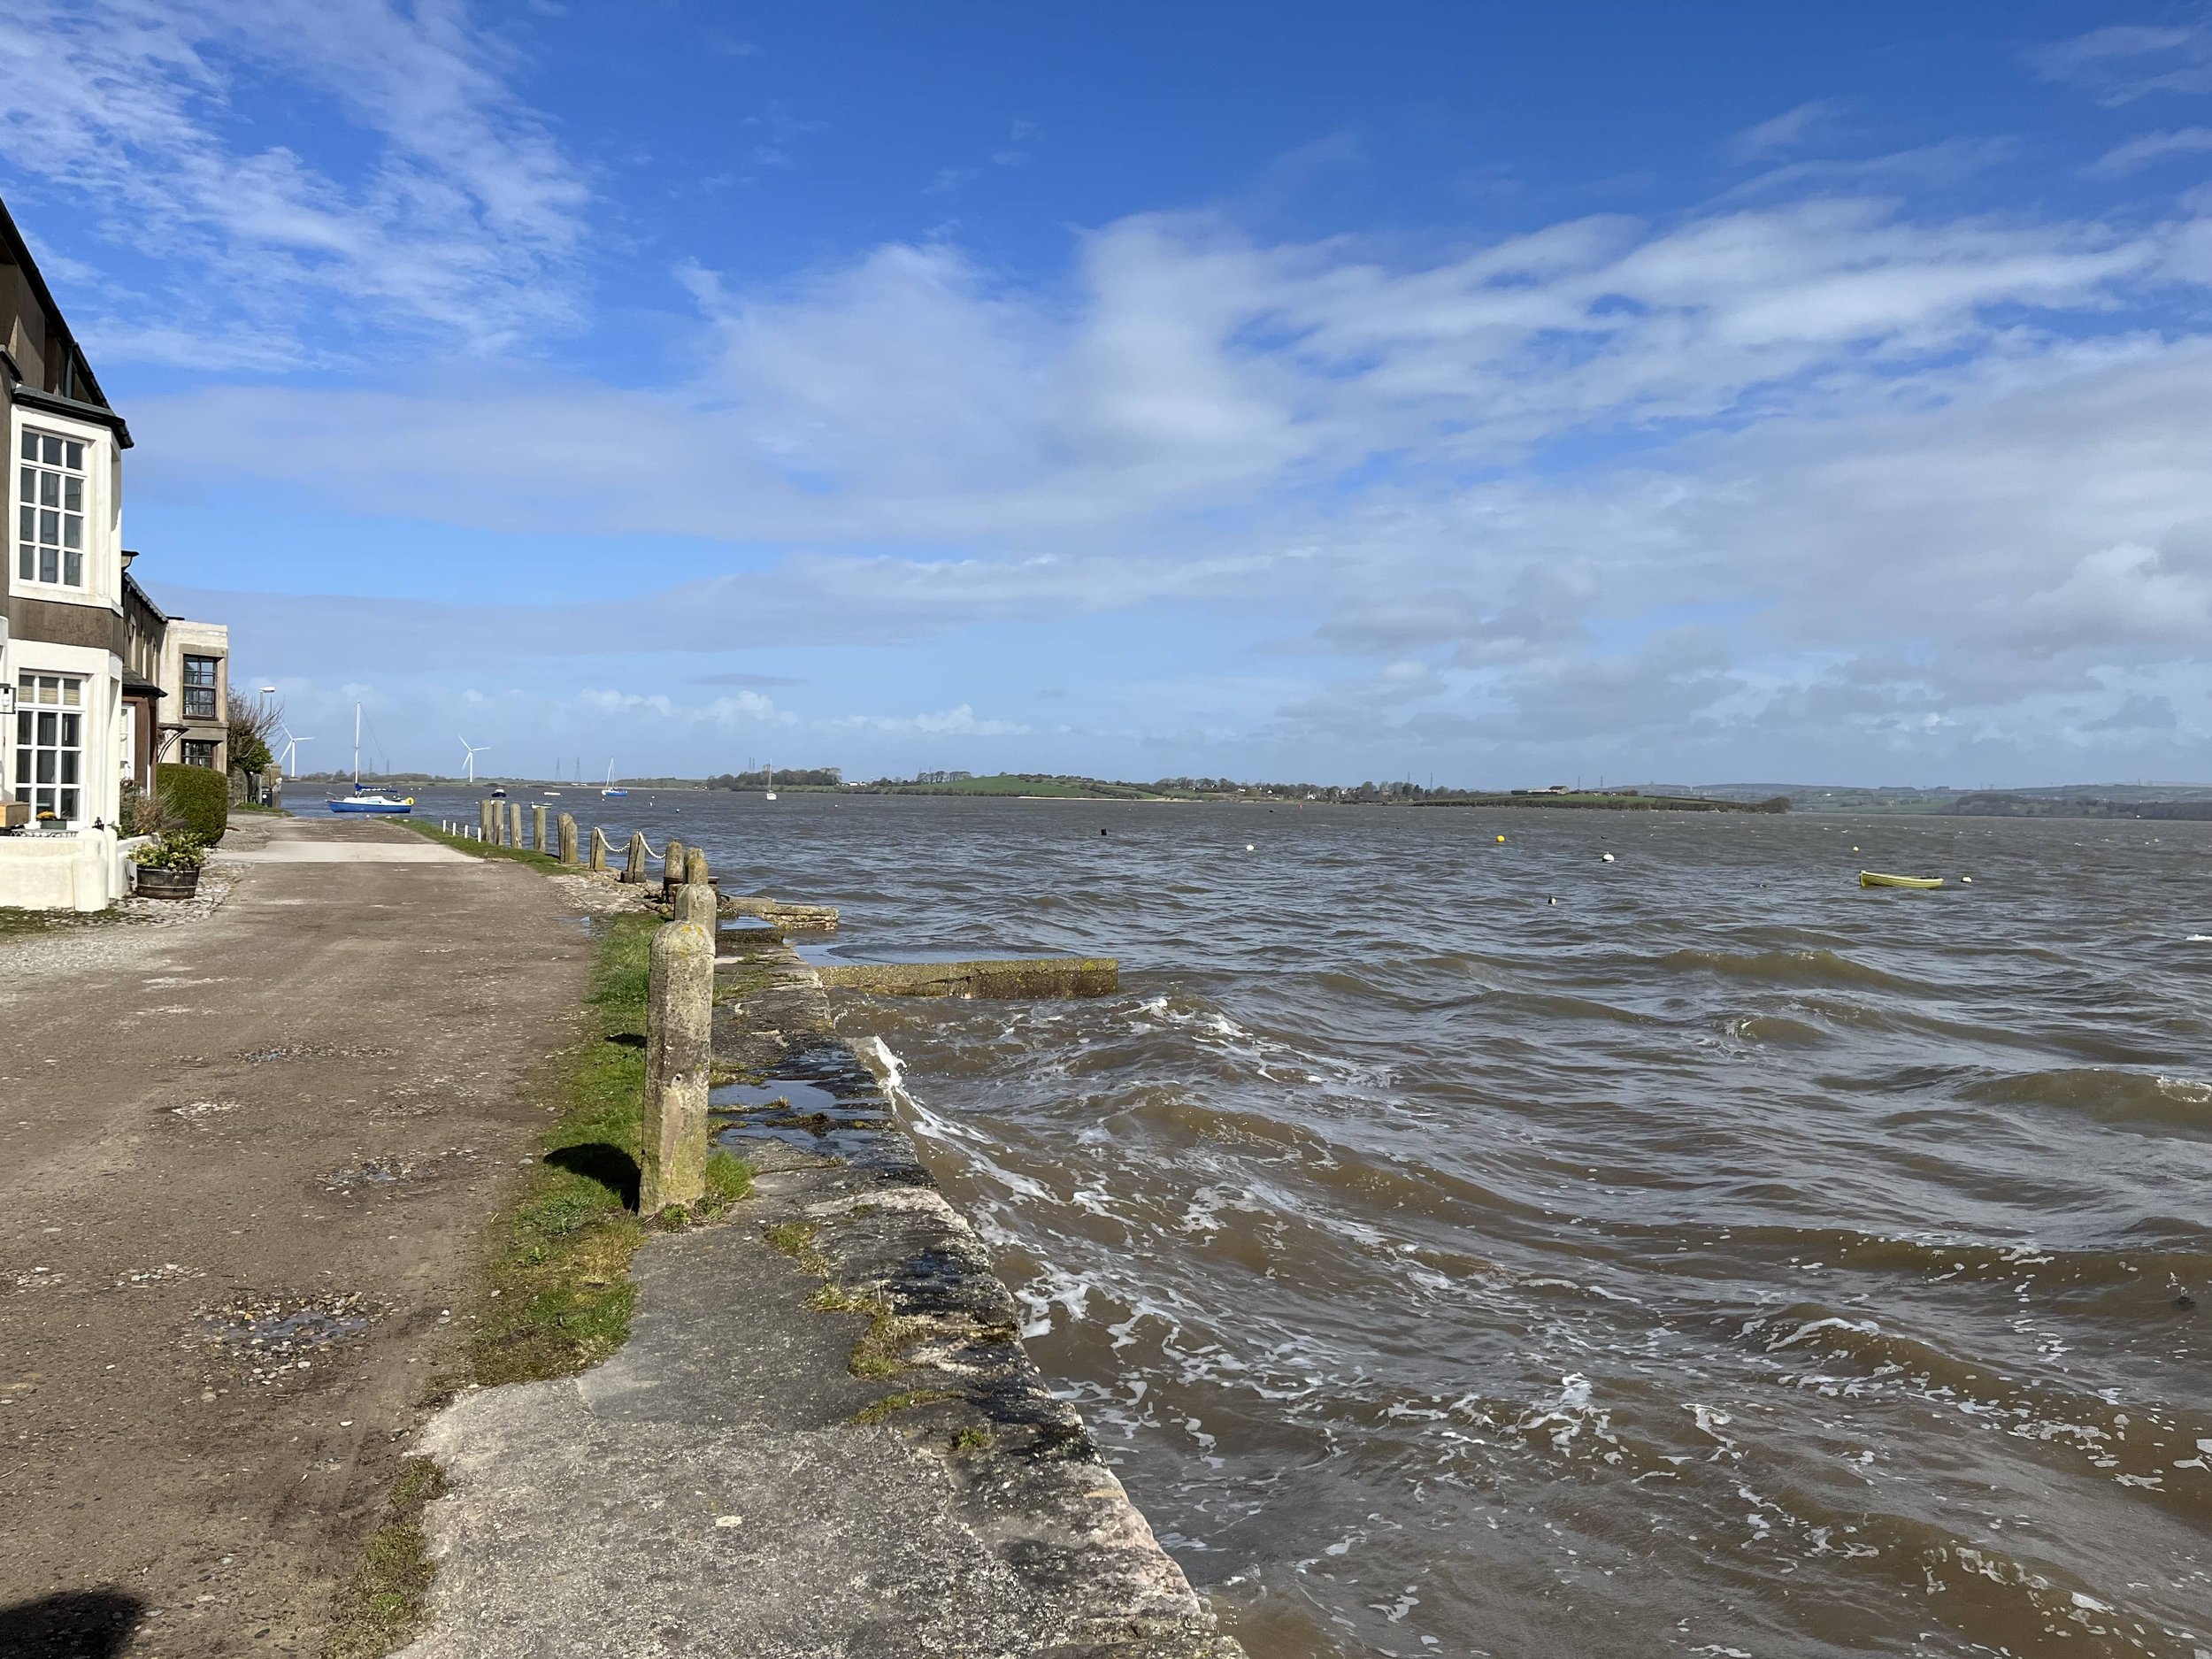
Close to high tide on the 23rd of March 2023: From the collection of Bill Morris
Factors affecting the tide
There are three key reasons which decide the height of the tide
Astronomic height
The prediction in the tide table.
Storms at sea
Storms in the Irish Sea, particularly when a strong wind blows from the south-west direction a tidal surge significantly increasing the height of the tide.Atmospheric pressure
Low pressure allow the sea level to ‘expand’ and generate higher tides. This aggravates the effect of storms as low pressure tends to increase stormy weather.
High pressure pushes down the sea level and creates a calmer environment.
Safety on the Causeway
Each year several vehicles get caught out by the tide on the causeway between Overton and Sunderland. Many visitors do not understand the speed with which the tide can flood the road.
The road gets covered in water on most days each month during the period of high tide (The period of high tide can last for up to two hours before and two hours after high water). There are some days when the road remains dry but these are less common. Everyone who crosses the causeway should be aware of the state of the tide and also whether it is rising or falling. Check the tide before you cross.
There are no hard and fast rules. In general a tide which reaches a height of above 7.5 metres in bad weather can cover the road at some point. The causeway is 2 kilometres long (1.2 miles) and takes 5 - 10 minutes to cross in a vehicle. During this time, on a rising tide the road ahead can become flooded barring your way.
The road is narrow in parts with few turning places. Many accidents occur because drivers see a flooded section and attempt a 3-point turn - the edge of the road has no curb and it is easy to end up in a gulley.

The rescue of the occupants of a car stranded in the tide: From the collection of Alan Smith
The Tidal Trap
A map of the causeway is shown below:

The road is planning your demise! Beware!
There are three sections that flood early as the tide rises:
The foreshore approaching the shingle area near to the public toilets.
This section is the first to flood and the last to clear.Wood Bridge
This section will flood quickly after the foreshore.Lades Bridge
This is the last section to flood and the first to clear.
Approaching from Overton on a rising tide, you might pass easily over Lades Bridge as the way looks clear. However the Foreshore will flood ahead of you and by the time you get there, that part may be impassable! It may be too late to go back because now Wood Bridge and Lades Bridge could have flooded.
If you can’t proceed, then use the escape road shown. Park at the top of the embankment and await the passing of the tide.
Note also, that the shingle area near the public toilet can also get flooded on a very high tide.
As very high spring tides always occur around lunchtime, it’s best not to plan romantic picnics at this time of (lunar) month!
When is it safe to visit?
A guide is to look for the time of Low Tide. It is always safe to cross 2 hours before and after the time of low tide.

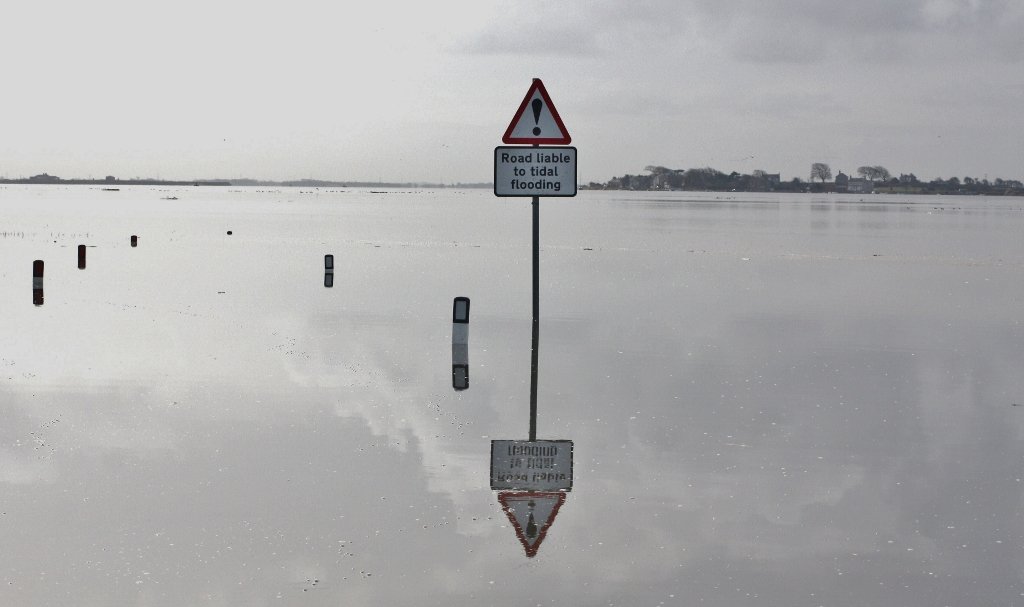
Looking towards a totally submerged causeway: From the collection of Bill Morris
Click on this button to return to Environment home page.
Or, to enter the next page ‘The Causeway’ click here